Segments – An Analyst’s Best Friend! Part 2: Secondary Dimensions
In part 1, I wrote about the details of Advanced Segments. They are incredibly powerful and will help you take your analysis to the next level. But as I mentioned in that article, when I think about segmentation, it comes in two forms in Google Analytics:
1. Advanced segments
a. Out of the box segments such as New vs Returning Users, Device Type, and traffic types
b. Custom Segments that you create
2. Secondary Dimensions
In part 2, I’ll be going into details on Secondary Dimensions.
So – the Who, What (for), When, Where, and How of Secondary Dimensions.
Who: Anyone can use them, and you don’t need anything beyond user level permissions (basic permissions) to take full advantage of Secondary Dimensions.
What: Similar to Advanced Segments, the purpose of Secondary Dimensions is to slice and dice your data set for a more advanced analysis. Unlike Advanced Segments, however, Secondary Dimensions are only available in the data table of standard reports and are based on the dimensions you already have available to you in your analytics account (versus creating new ones on the fly with Advanced Segments). These dimensions can include any Custom Dimensions you’ve create and collected data for.
When: Secondary Dimensions are retroactive when applied to your data set, just like Advanced Segments. If and when you have a question that requires diving deeper into a particular dataset, you can easily apply a secondary dimension to a standard table report in Analytics to breakdown each individual row by a new dimension.
Where: Secondary Dimensions are found on the left hand side of the title bar of each table report in the Standard reporting interface.
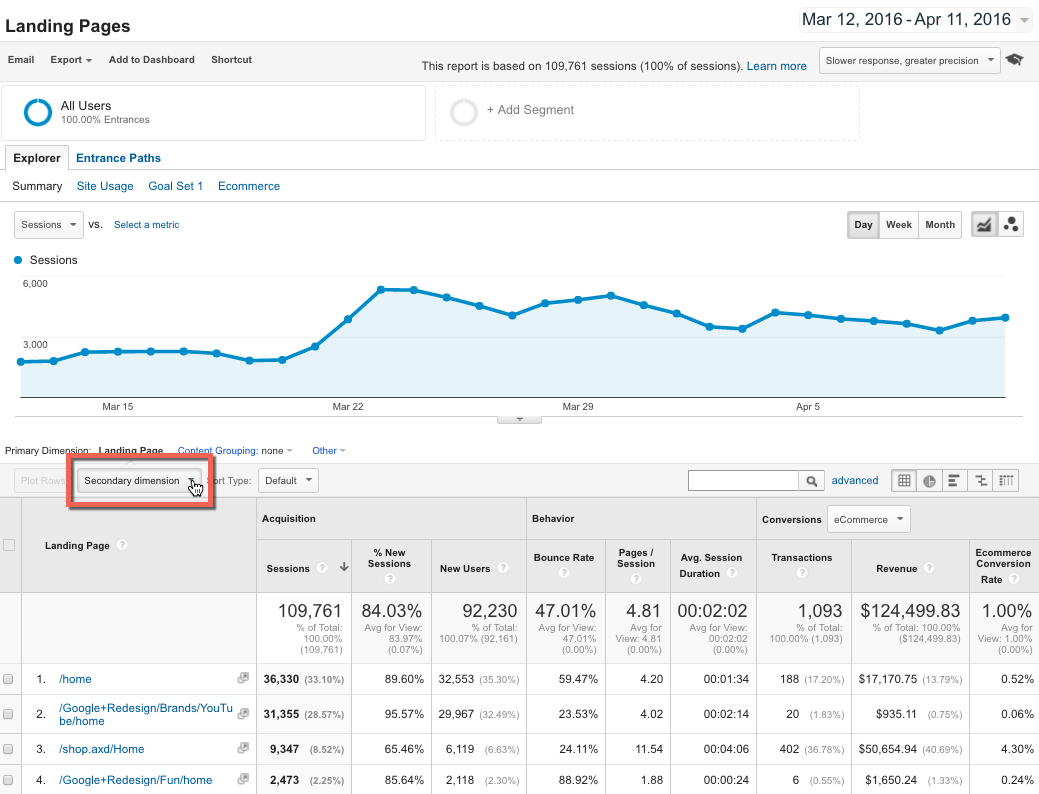
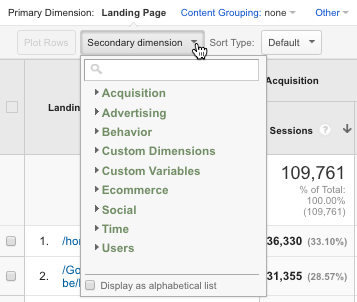
Click on the drop down labeled ‘Secondary dimension’ to see a list of categories available to click into and scroll through, or start typing the particular Dimension name you are interested in to narrow the list.
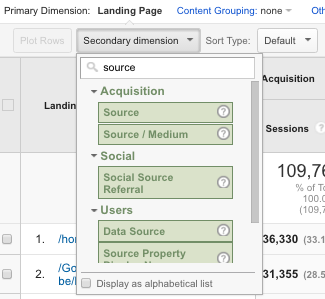
How: Once you’ve chosen a Secondary Dimension to apply, in this case, ‘Source/Medium’, it will add a second column into your original report (Landing Pages report in this example) to break down each row of landing pages by the Source/Medium that drove the user to that landing page.
Using Secondary Dimensions for Analysis
Example: As an analyst, I noticed that the Google Merchandise Store saw an increase in sessions reported in the landing pages report, starting around March 22. The landing pages report will show this bump (as would other reports), and I decide to plot rows to figure out which pages saw the largest increase at the time to see if I can narrow the source of the traffic increase.
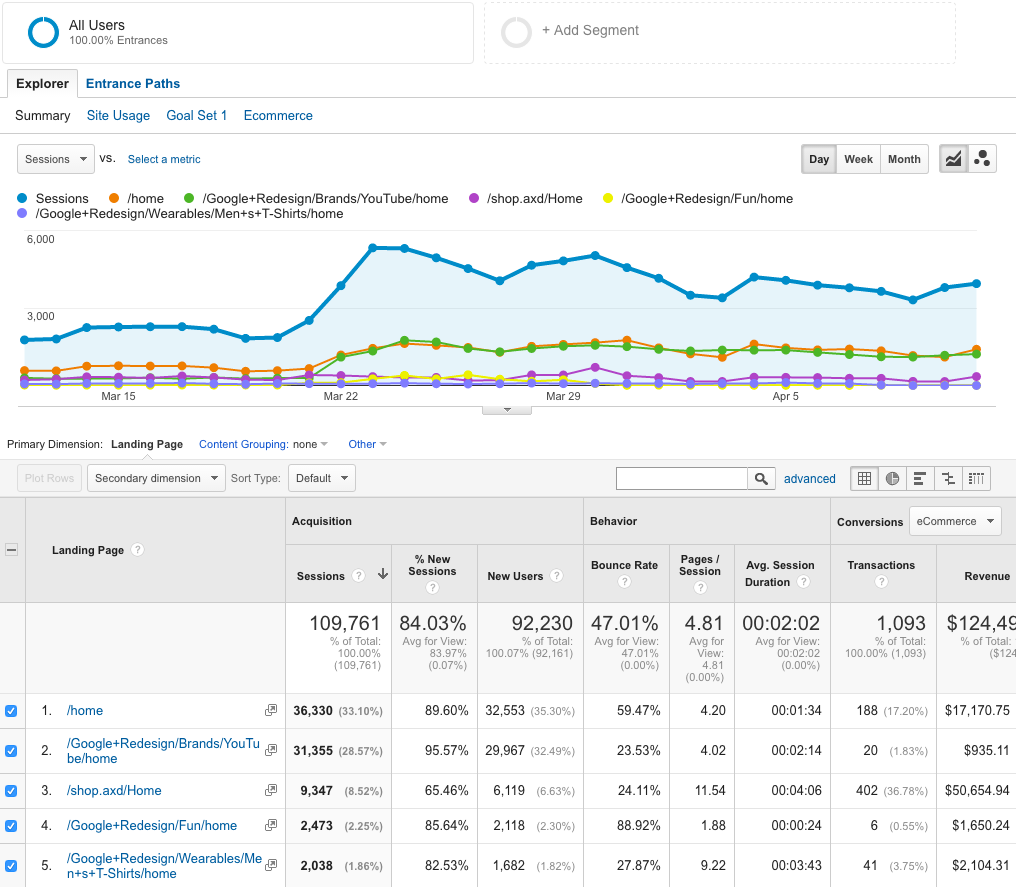
After doing so, it looks like the spike is coming primarily from the homepage and the Youtube brand page. Naturally, as an analyst, I want to know what is driving this spike, so I’m going to apply a secondary dimension of Source/Medium to see where this increase in traffic is coming from and plot rows to confirm.
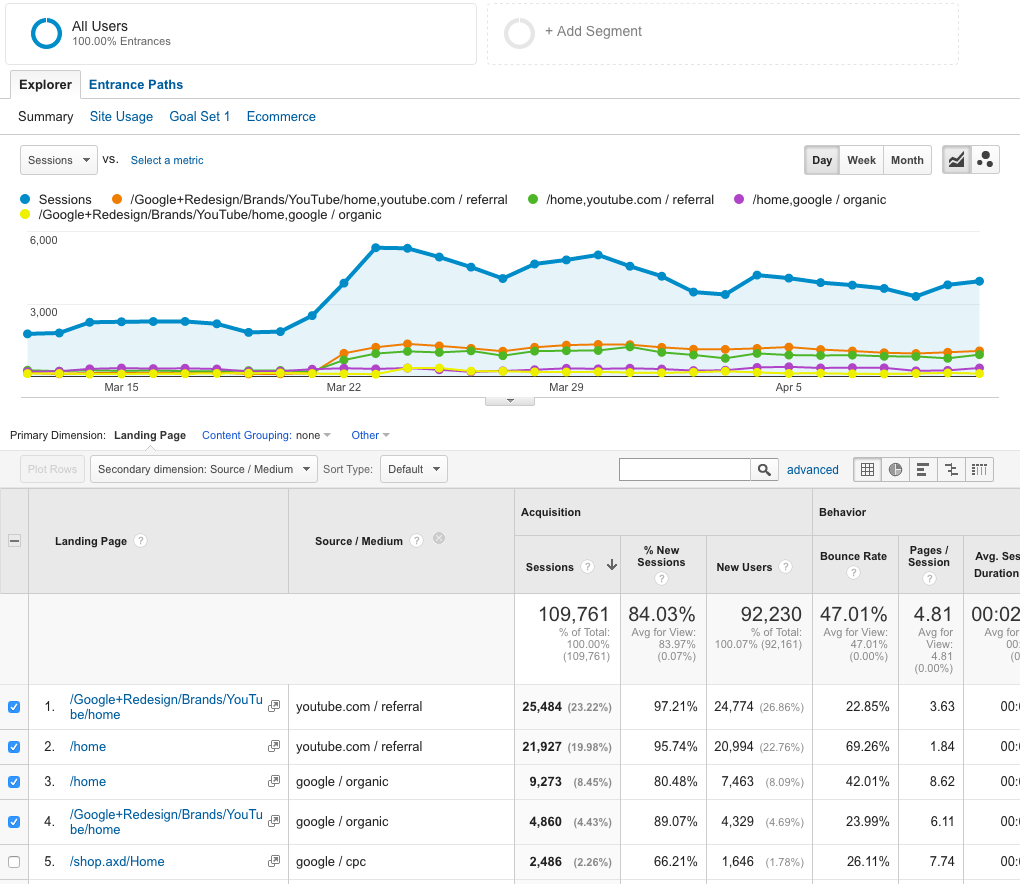
It looks like the increase in traffic to both the Youtube brand page and Home page is being driven by a referral link from youtube.com. Notice that lines 3 and 4 also show that the home page and the Youtube brand page are top landing pages by Source/Medium of ‘google/organic’, but when we look at the graph it doesn’t appear that these are driving the spike. I can now make the conclusion that the majority of increase in traffic to the website, most noticeably to the Youtube brand page and the home page, are being driven from a new referral link on youtube.com. Great! Mystery solved!
As an analyst, the questions keep coming from there. Is the increase in traffic qualified? Are they performing well (in the case of an ecommerce store like the Google Merchandise Store, this could be quantified by checkout goal completions), is the source of this link (and thus increase in traffic) constant or temporary? Can I optimize the experience for this new influx of traffic in order to drive more sales?
All of these questions come out of the deeper level of analysis I was able to do by adding the secondary dimension to get to the bottom of the new incoming traffic source, and many of these questions could be addressed by diving into other reports and adding other secondary dimensions or advanced segments. These findings could then lead to a solid presentation to senior business leaders as to the impact and effects of the youtube.com referrals and how best to address that increase in traffic. Great analysis!
As you can see from this short example, applying and using Secondary Dimensions is easy and can lead to much deeper analysis and insights as to what is driving traffic and actions on your websites. My plea, then, is that you make Secondary Dimensions a primary source for your analysis toolset, you won’t regret it!

Pingback: Digital Debrief – Mixing Google Analytics Dimensions and Metrics