Segments – An Analyst’s Best Friend! Part 1
Advanced Segments are quite possibly the most powerful slice-and-dice tool available in Google Analytics. Recently, however, it came to my attention that even some of our biggest and most advanced users are not using/under-utilizing advanced segments!
When I think about segmentation, it comes in two forms in Google Analytics:
1. Advanced segments
- Out of the box segments such as New vs Returning Users, Device Type, and traffic types
- Custom Segments that you create
2.Secondary Dimensions
Because these are both large topics in and of themselves, I’ll be splitting this post into 2 parts. In part 1 I’ll talk about Advanced Segments, and part 2 will cover Secondary Dimensions.
So – the Who, What (for), When, Where, and How of Advanced Segments:
Who: Anyone can create them! Segments are created at the user level, so every access level to Google Analytics can create segments. If you want to share segments with the whole property or other views, however, you’ll need to have admin permissions.
What: The purpose of segments is to slice and dice your data set in order to draw deeper insights from it. For example, mobile users may have very different behavior on your website than desktop users. Segmenting your data to analyze these two groups separately and together could reveal some very interesting observations and action items for your business.
When: One of the great things about segments is that they are retroactive. You don’t have to create them ahead of time to be able to get the benefit. If and when you have a question that requires segmenting your data, you can easily apply a segment you already have or create a new one very quickly.
Where: Segments are found in the upper horizontal nav bar, below your export options, and are arranged in rectangular tiles across this bar. The default segment of ‘All Sessions’ will always be on unless you remove it. As you add more segments, the tiles will shrink, up to a max of 4 segments at a time.
All Sessions segment
Up to 4 segments can be applied at a time
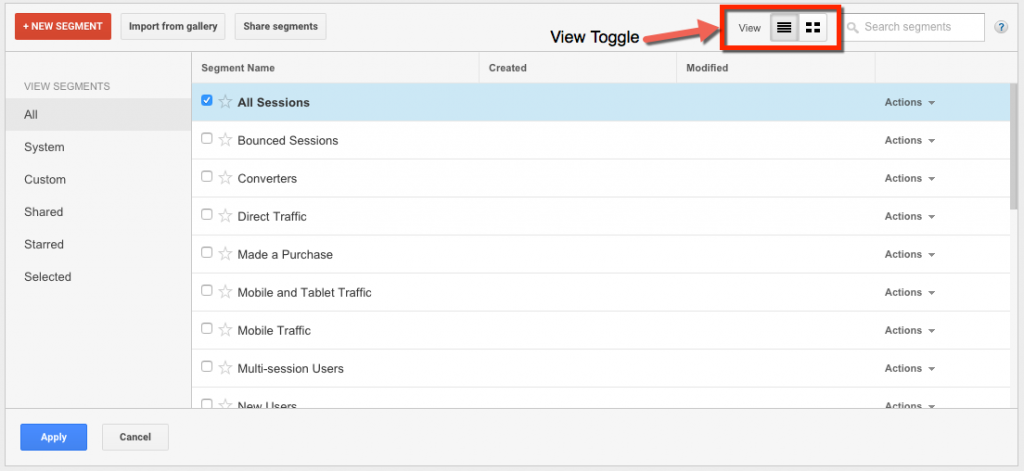
How: Apply or creating segments is easy. Google Analytics comes with several pre-configured segments already, such as X, Y, Z. To apply one of these, click on the ‘New Segment’ tile next to ‘All Se’ and choose the segments you are interested in from either the tile view or the list view. I personally prefer the list view, so I’ve changed this via the toggle at the top corner of the segment box to be the default view.
Creating your own custom advanced segments is easy, but also provides you with a ton of options to get very creative and advanced in your segmenting and analyzing needs. To create a new custom segment, follow these 5 steps:
- Click the + New Segment tile, and rather than scrolling through the list of predefined, choose one of the 5 left-hand nav options for Demographics, Technology, Behavior, Date of First Session, of Traffic Sources
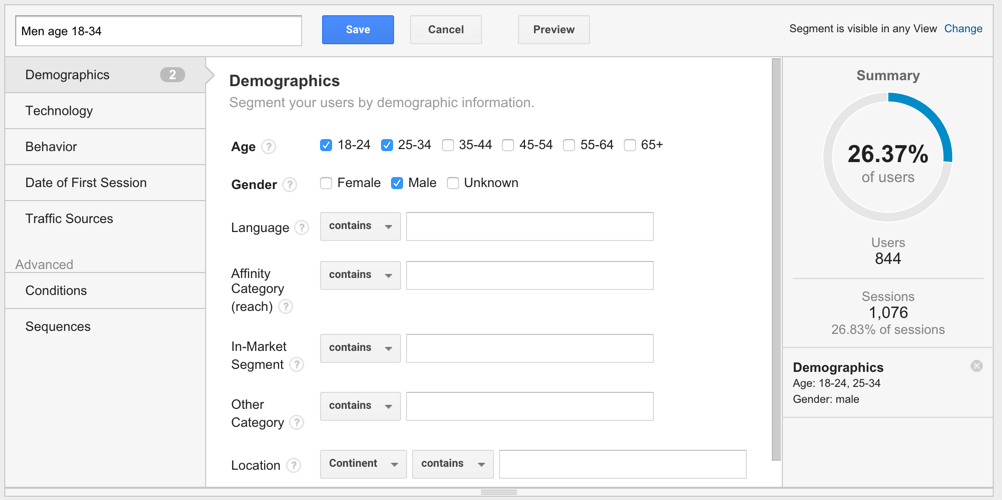
- Ex. demographics: Fill in the checkboxes or fields for greater than/less than/contains/etc for the demographics you are interested in. In this example, I’ll choose age groups 18-24 and 25-34 and gender Male.
- Test: Look at the right hand side bar. There is a circle chart that shows you how much of your current data will be captured by the segment you are creating. Try adding or subtracting criteria to make sure the data aligns with your expectations and looks believable. If you see no data included, check your criteria for spelling mistakes, granularity (maybe your criteria is too specific), and filter choices (include vs exclude).
- Name the segment (I usually save this step until after I’ve created and tested the segment because I want the name to reflect the exact purpose that I’ve built
- Save and apply
My completed test segment looks like this:
Using segments in analysis:
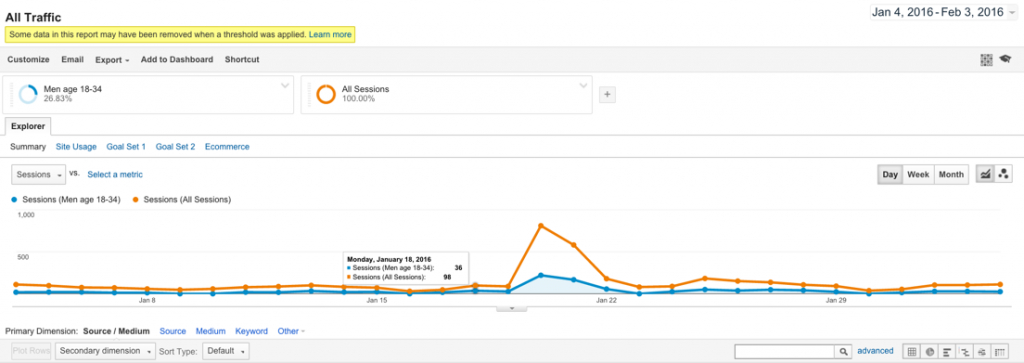
Once I’ve saved the above segment, it will automatically be applied to the data set I am looking at. Also note that segments stay with you as you click around in the interface to different reports until you remove them.
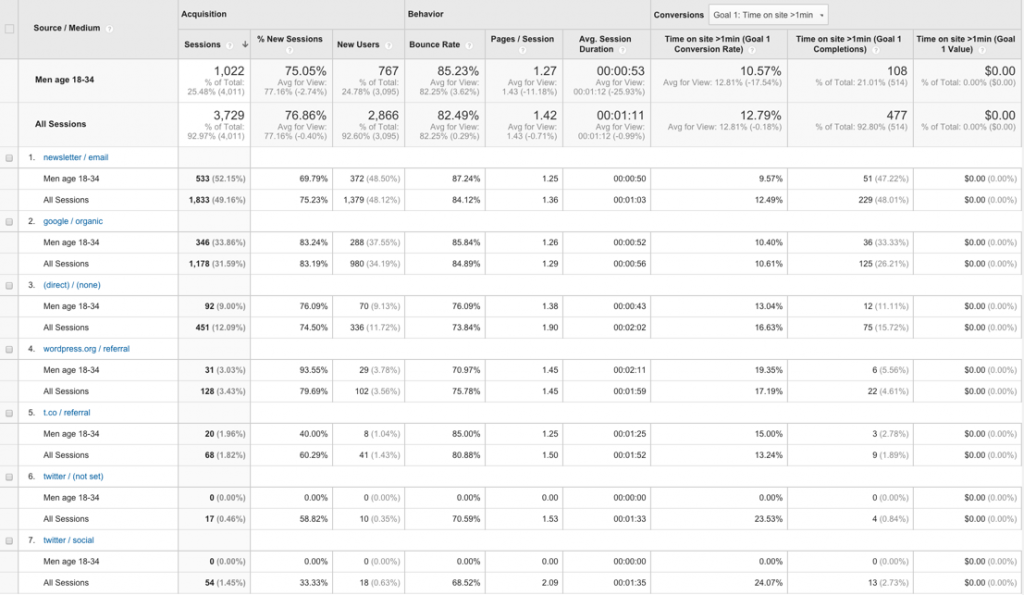
If I want to look at the Traffic Sources report for source/medium to see how Men age 18-34 get to my website as compared to all sessions, I can navigate to that report with my new segment applied. This is what I should see:
In this case, even though when I tested the segment it said that Men age 18-34 made of ~26% of my traffic, I actually see that ~29% of my traffic coming from newsletters are in this segment group. Looking further down, only about 24% of users coming from a WordPress referral fit into this segment. These data points begin to tell me which acquisition channels perform best for each of the different segments of users I am analyzing and can help me to change or target my marketing strategies to optimize incoming traffic.
Creating and using custom segments is as simple as these 5 steps. In a follow up post I will go into more detail about the last 2 categories of custom segments, Conditions and Sequences, to show you how you can get even more advanced with segmentation to help take your analysis to the next level.


Christopher Rose
Thanks for this
Pingback: Digital Debrief – Segments – An Analyst’s Best Friend! Part 2: Secondary Dimensions