Analyzing Reports in the new App + Web Property
Now that we’ve had data coming in to our new App + Web property for some time, I’d like to deep-dive on a topic near and dear to any analyst’s heart: Reporting. Being able to map what we see in an A+W property back to something we know in Universal Google Analytics is important to help us as analysts make (or rather, smooth) the mental transition.
To do that, I’ll look at a few common reports from Universal Google Analytics and A+W for the same time period to compare and contrast. Keep in mind, they are collecting data in different ways, so it’s reasonable to see a difference in numbers for things like Users and Sessions.
Before we begin, I want to take a moment to define some of the new metrics you’ll see in a table report in an App + Web property:
Engaged sessions: The idea of an engaged session stems from wanting to remove bounces from the session count, therefore, an engaged session is only counted as such after the user has been on site for 10 seconds. If they leave before then, it will count as a bounce but not as an engaged session.
Engaged sessions per user: Number of engaged sessions per user, so if we see the same user ID coming back multiple times, this may be 3, 4, or 5 sessions per user, then averaged out over your total user count, giving you an average above 1, with the actual number dependent on how many new vs returning users (or deleted cookies) your content has.
Engagement time: this one is perhaps my favorite new metric. Why? For years, I’ve been talking about why I hate the metrics ‘Bounce Rate’ and ‘Time on Page’ in Universal Google Analytics. There is good reason for this dislike: the metrics are flawed in how they are calculated due to how the use of the web has changed since the inception of these metrics more than 15 years ago. When it came time to re-evaluate the metrics going into the new App + Web property, myself and a handful of others pushed very hard to improve on these metrics.
In Google Analytics for Firebase, there is a metric called ‘Engagement time’, which I like much better because it is calculated as the actual time in foreground for the app which is much more reliable than ‘Time on Page’ in Universal Google Analytics. For A+W, we wanted to bring a similar logic, but due to how browsers and tabs work, that is much harder. Our small team spent quite some time debating on the best way to calculate a metric that would be meaningful for analysis, and eventually came to ‘Engagement time’ for web which is meant to be synonymous with how it’s calculated in app, using some new handlers to closely follow the tab in foreground, screen sleep time, etc. Essentially, a much better calculation of time on page.
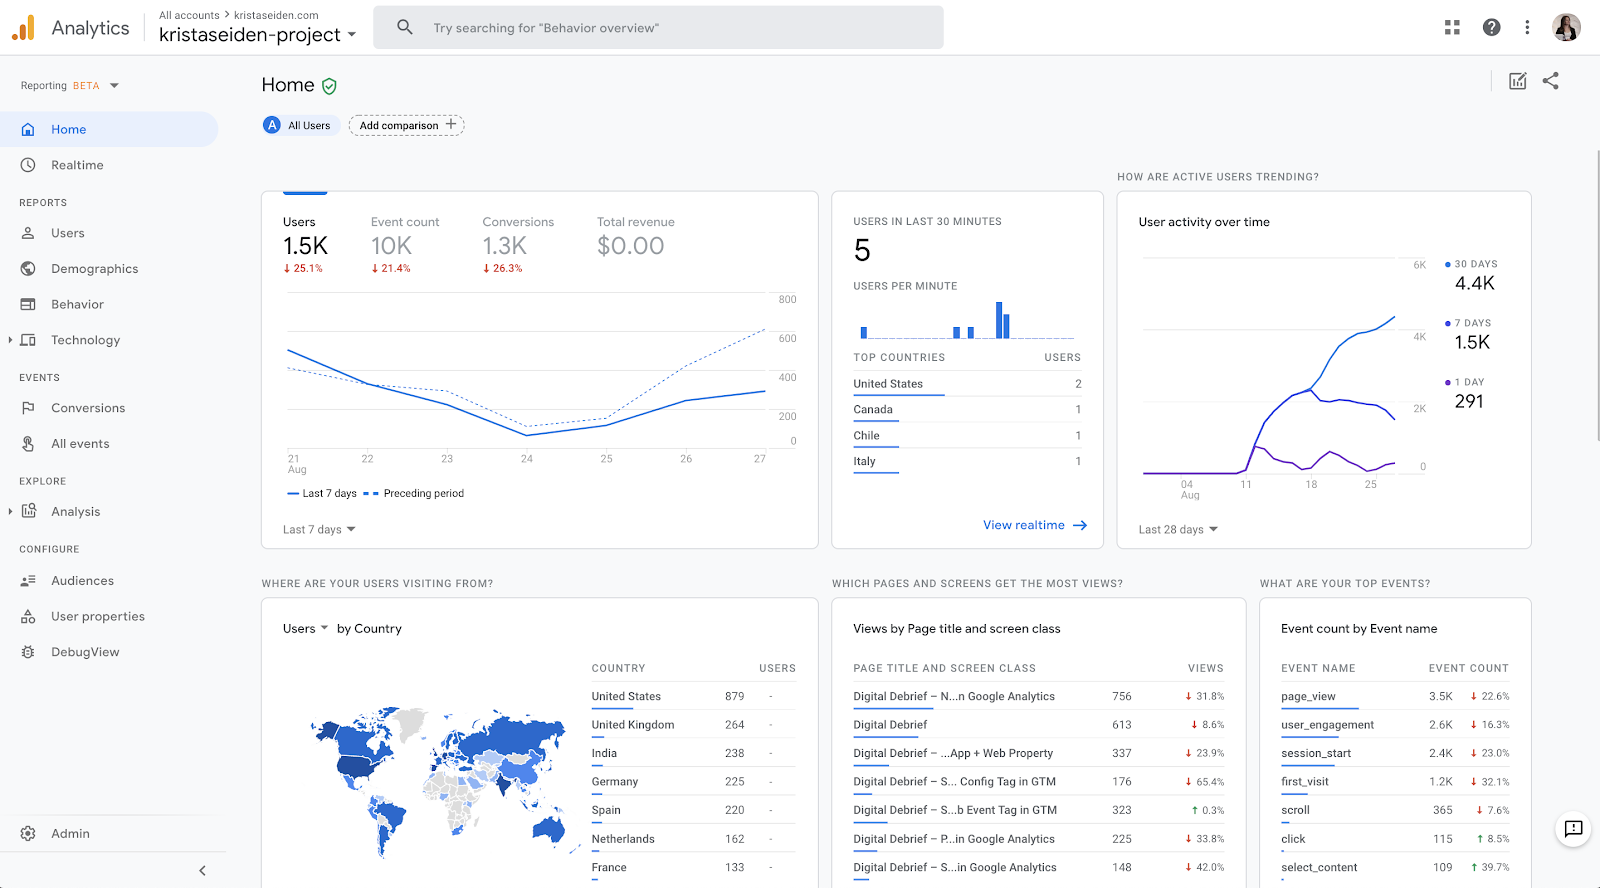
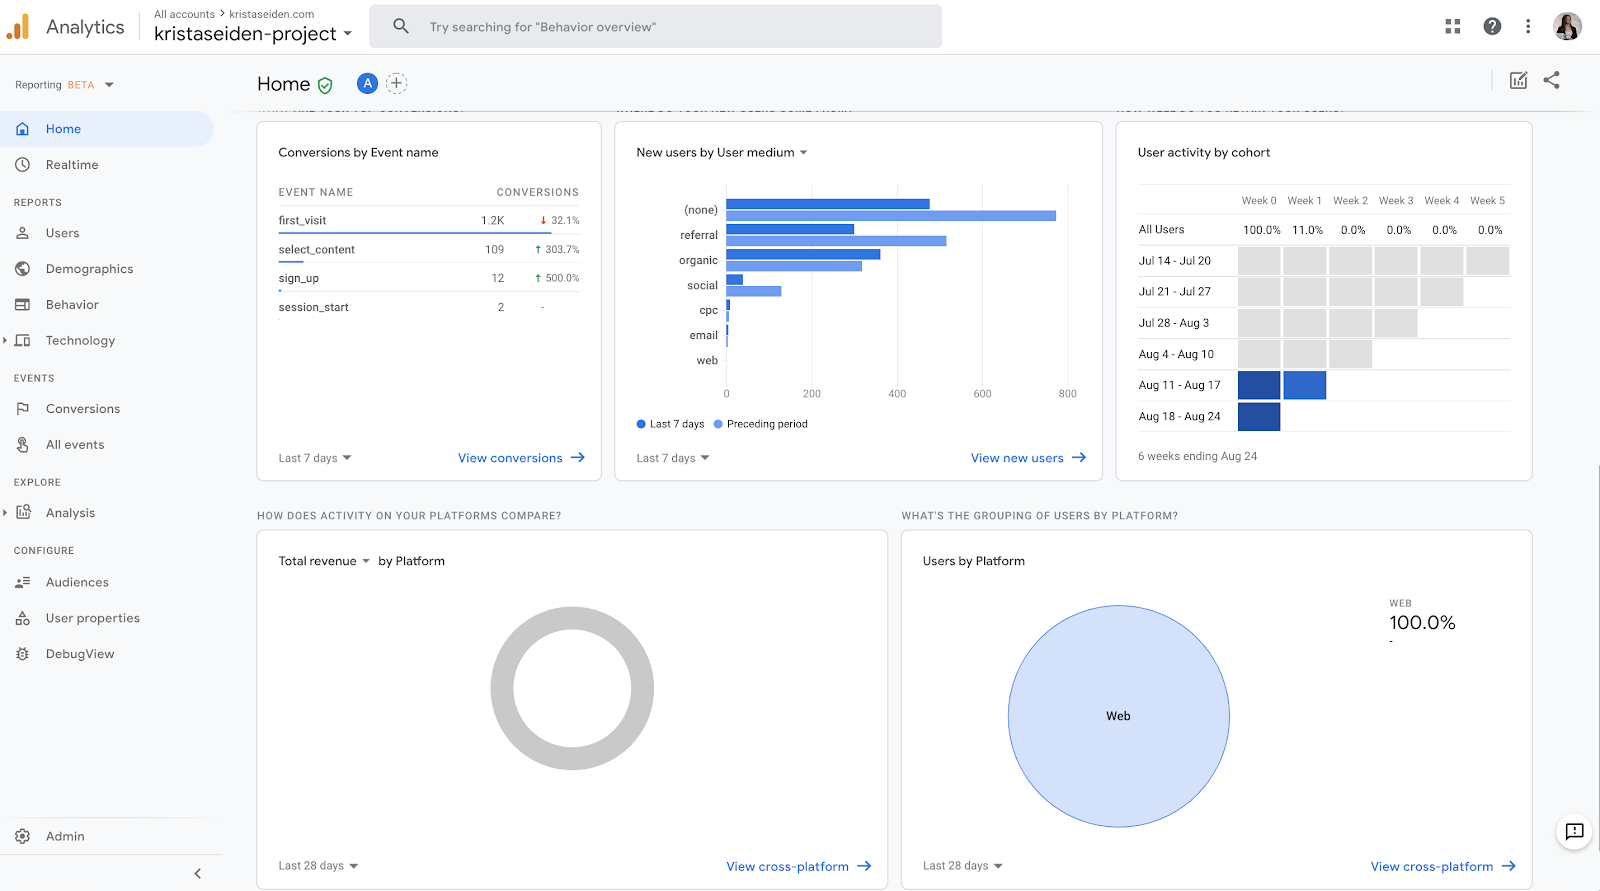
Now that we’ve defined some of the new metrics available, let’s deep dive into a few reports. As an analyst, I almost always start my analysis in one of two places. First, I’ll usually check in on the ‘Home’ dashboard to get an idea of the total amount of traffic (by day/week/month) as well as a high level view of what’s going on. I’d like to note that this ‘Home’ report is such a huge improvement to having a real dashboard/pulse of what’s going on over the old default of the Audience Overview report, that it has legitimately made its way into my normal reporting efforts. A lot of user research and effort went into building this out, so congrats to the GA reporting team on a job well done (and I’m sure they’d be open to feedback on how to continue to improve!)
The home screen in the new A+W looks a lot like what you’d expect, and very similar to the ‘Firebase Reporting’ version (aka what you’d see in GA for Firebase rather than the Beta reports for A+W) as well as what is available in Universal Analytics.
Home screen in A+W:
Home screen in Universal Analytics:
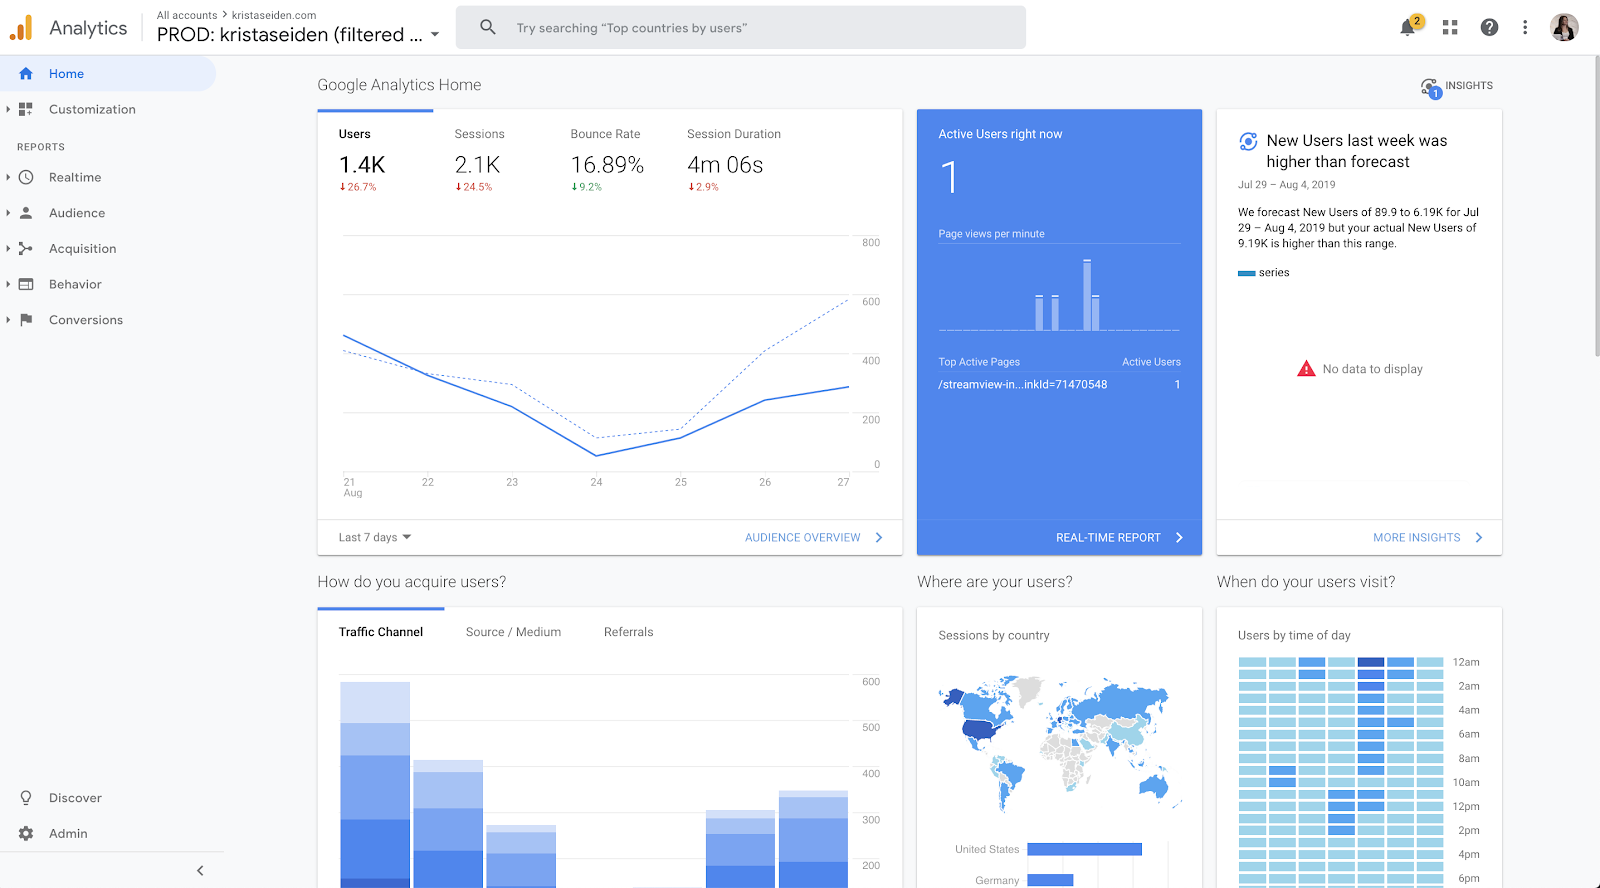
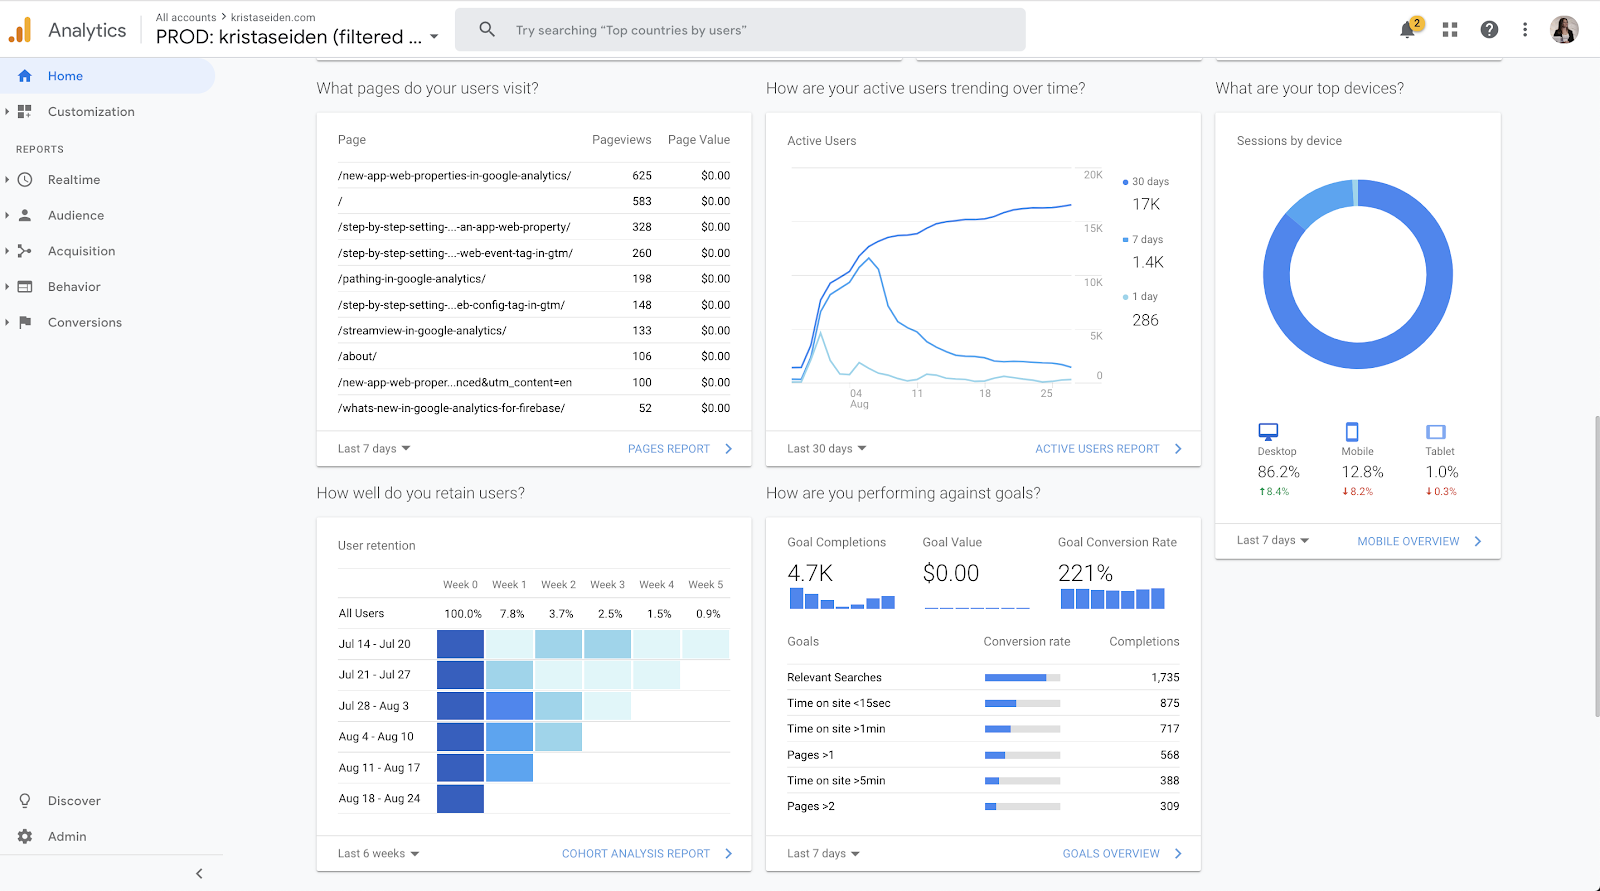
One thing notably missing from the A+W side is the ‘Insights’ card and related available Intelligence reports. Check out my previous post about those reports, they’ve gotten so much better in Universal Analytics, I can’t wait to see them make their way into A+W!
Different than in Universal Analytics, one of the key reports in App+Web is the ‘Events’ tab. This overview report will show you a list of all events you have firing for you App+Web property.
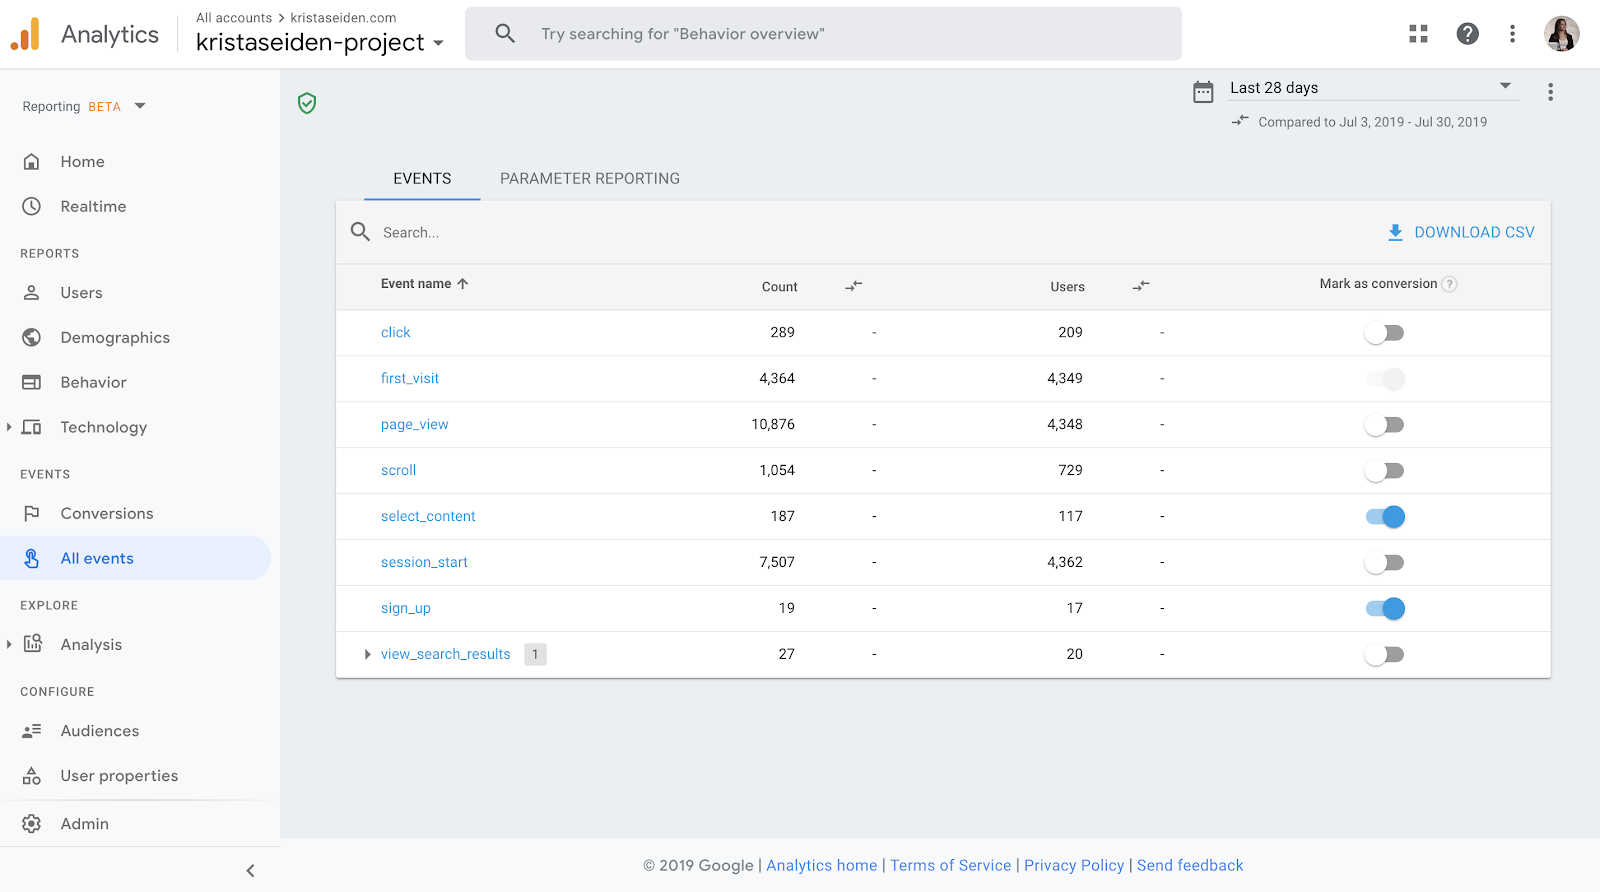
A few things to note here: You’ll see event counts by total count and by users (aka uniques) in columns. There is also a column titled ‘Mark as conversion.’ Selecting this toggle will unlock specific reporting for each event you’ve selected as a conversion (specific to attribution and LTV), and allow this event to be used in conversion reporting across the Google Marketing Platform (for example, in Google Ads). This has been a feature in Google Analytics for Firebase for sometime, with use for ad conversion targeting for Universal App Campaigns (UAC).
Another thing to pay attention to here is the number listed next to the event ‘view_search_results’. This implies there is a registered parameter associated with this event.
An important note on Parameter reporting: currently, you’ll need to login to your Firebase project (console.firebase.com) and navigate to event reporting there to register a parameter to be used in reporting for it to show up in your A+W property. Even for ‘Enhanced Measurement’ events, such as ‘view_search_results’, you’ll need to register the parameter for ‘search_term’ on the Firebase side to get it to show up in A+W reporting. I suspect this is only a short term pain in Beta while the team continues to build this out, so hopefully this process becomes much smoother. I’d like to see parameters not require registration for reporting, but to just show up as available for anything using an automatic or suggested event, but there are currently limitations on the number of registered parameters so we’ll see how that pans out. Regardless, I suspect (or maybe it’s just that I *really* hope) that parameters for anything coming out of ‘Enhanced Measurement’ will be available automatically and not count towards the registration limits.
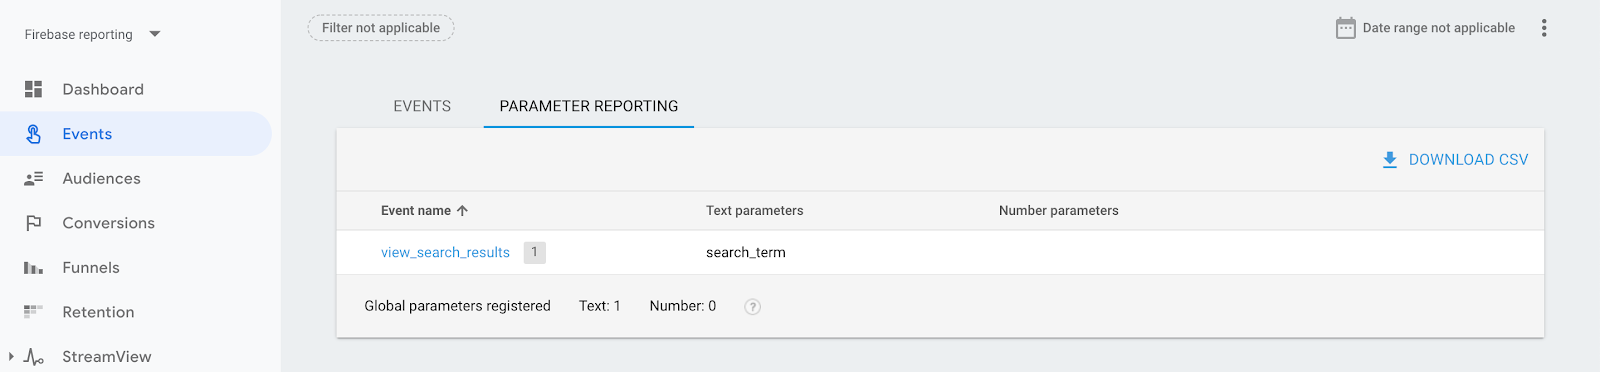
Image shows that I’ve registered 1 text parameter for the ‘view_search_results’ event on the Firebase side
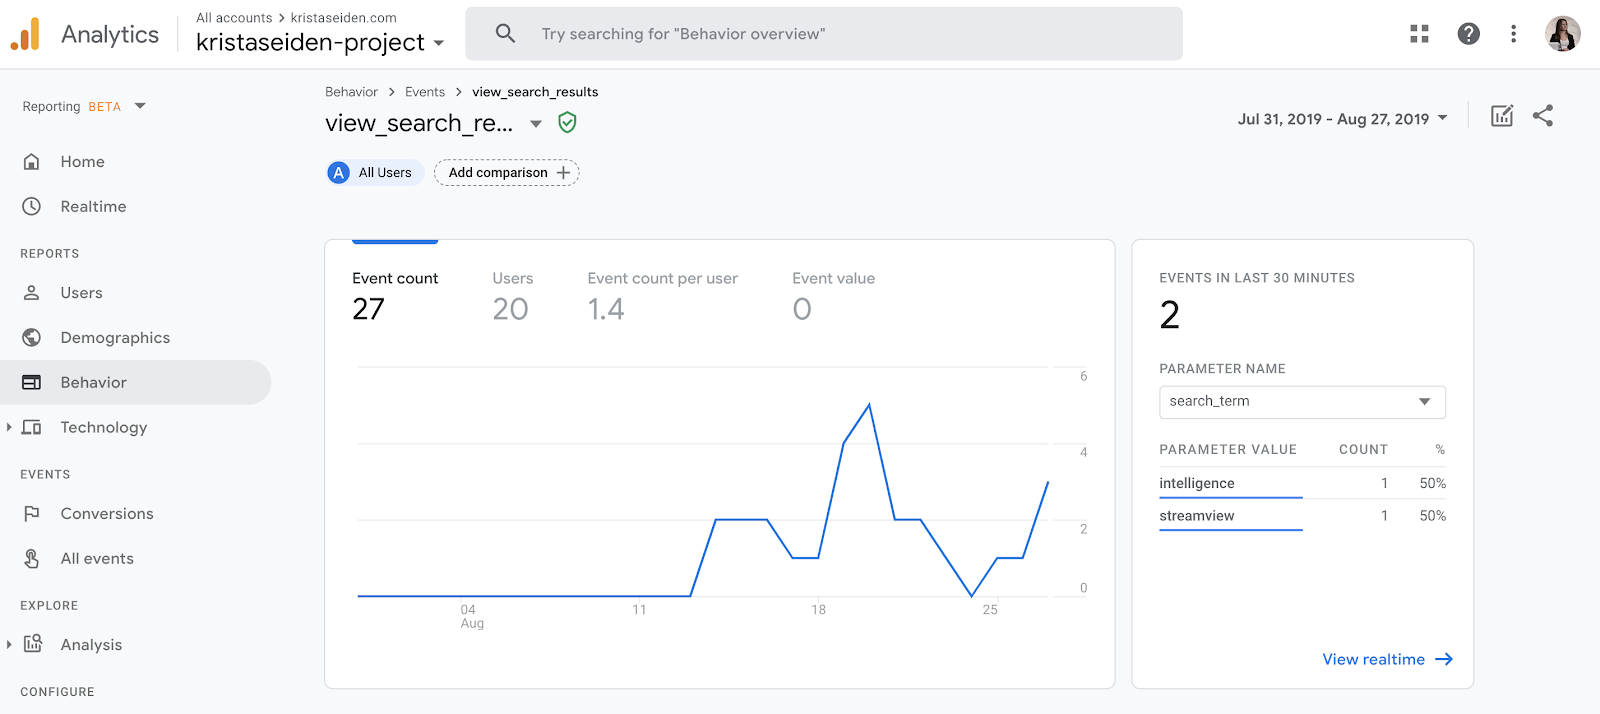
From this Events table, you can click into any one event to be taken to more detailed reporting for that specific event. A little oddly, this jumps you out of the ‘Event’ tab on the left hand navigation and into the ‘Behavior’ tab where you are dropped into the event detail report (whereas if you click on the Behavior tab outright, you’ll be taken to an overview table report separate from event detail).
On these detail reports, you’ll see a number of cards showing different details about the event. Of note here is the ‘Realtime’ card on each event detail report (which in the Beta reports is called ‘Realtime’, but in the Firebase reporting view is called ‘Streamview’, check out my blogpost on this report for more detail). The thing I really like about this particular card is that not only does it show how many users have been onsite in the last 30 min (different that ‘Realtime in Universal GA which is only current onsite users), but it also shows a dropdown selectable list of all parameters that you have registered to be able to see those in depth as well). For this event, I only have the automatic parameters such as ‘ga_session_id’ & ‘page_title,’ as well as the one event I have registered for ‘search_term.’

My favorite go to report in Google Analytics is typically to check my acquisitions traffic reports, specifically and almost exclusively, the ‘Source/Medium’ report. This is where A+W has some work to do: there is currently no option to look at acquisition reporting by Source/Medium as a single report, only by Source or Medium separately. Content (utm_content) is also currently missing in A+W. This has many limitations for analysis and leads to a need to toggle back and forth for an incomplete picture, or uses up the valuable secondary dimension to make the report on your own, but rest assured – this is a long standing Feature Request out to the team and I’m confident we’ll get Source/Medium and Content into the A+W beta reporting soon (currently these missing dimensions are something I suspect comes directly from the Firebase reporting side since they were never available there).
Let’s look at how these reports all compare. A few days ago, Charles Farina pinged me to ask if custom UTMs were available in App + Web. The answer is yes! However, it’s not as straightforward or easy to find, so here’s how to do it:
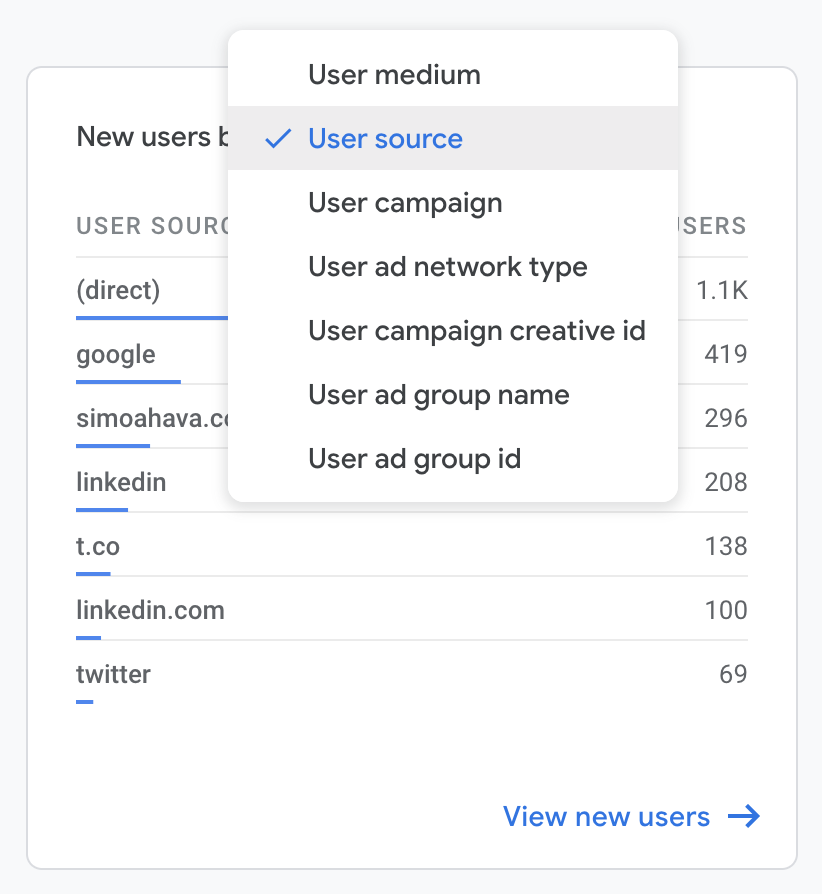
Click the ‘Users’ tab in the left hand nav → scroll down to the second row of cards to find the ‘New Users by Medium’ card:
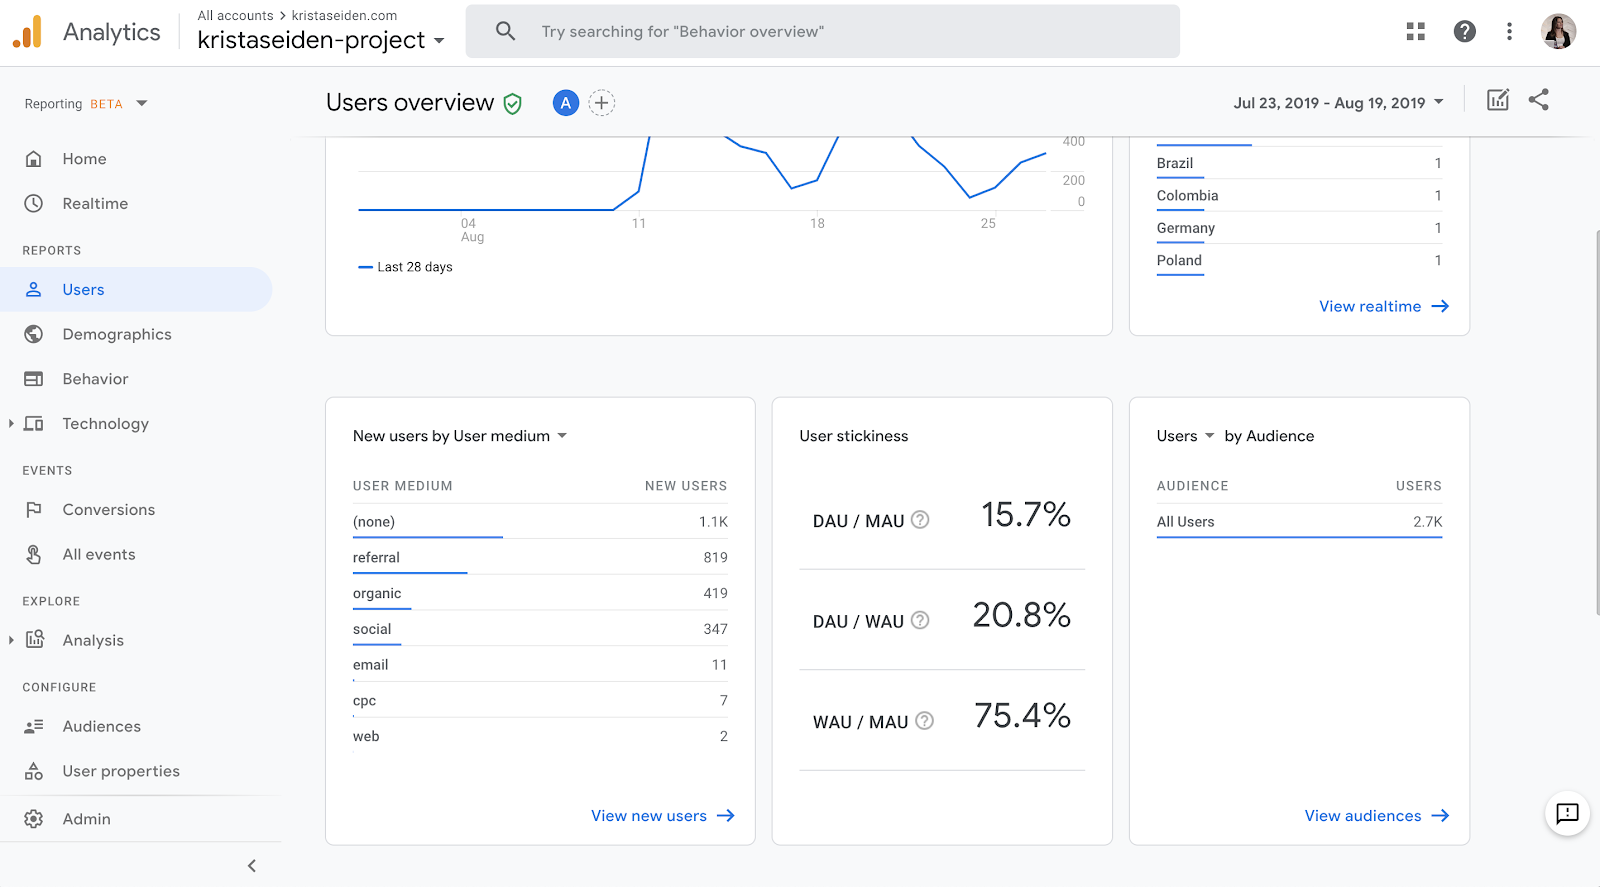
You can toggle ‘Medium’ to the other available dimensions directly on the card:
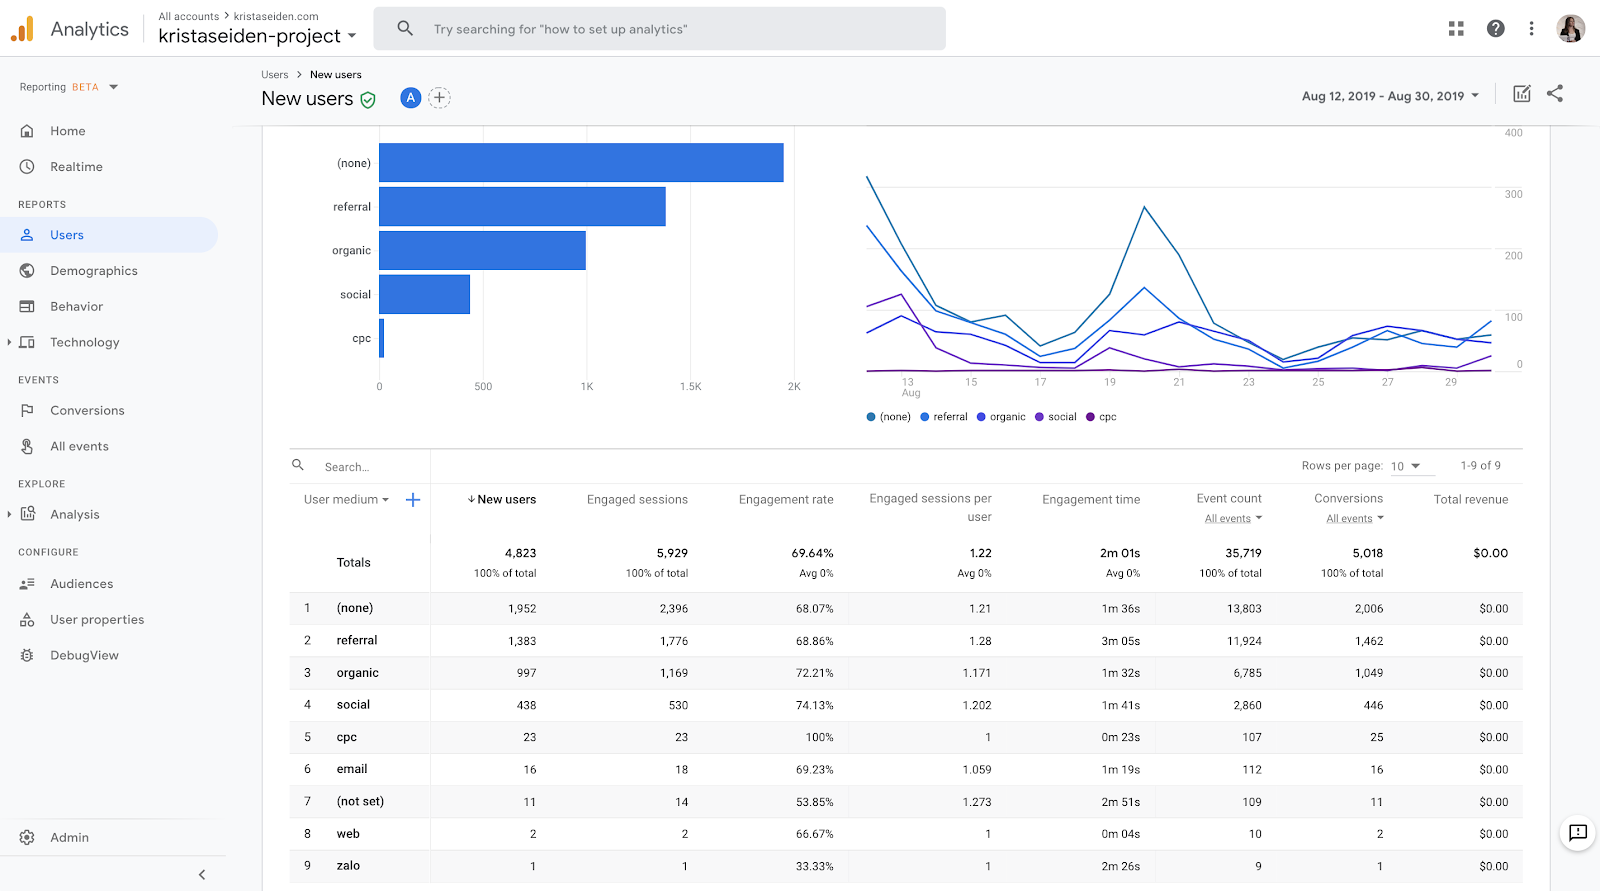
From here, click on ‘View new users’ in the bottom right hand side of the card, this will then take you to the full New Users report with a table available at the bottom of the page, defaulted to a primary dimension of Medium. In the below screenshot, I know that ‘social’ was from custom UTMs I created, however, this could also be a default, so it’s hard to tell what’s what just from this report.
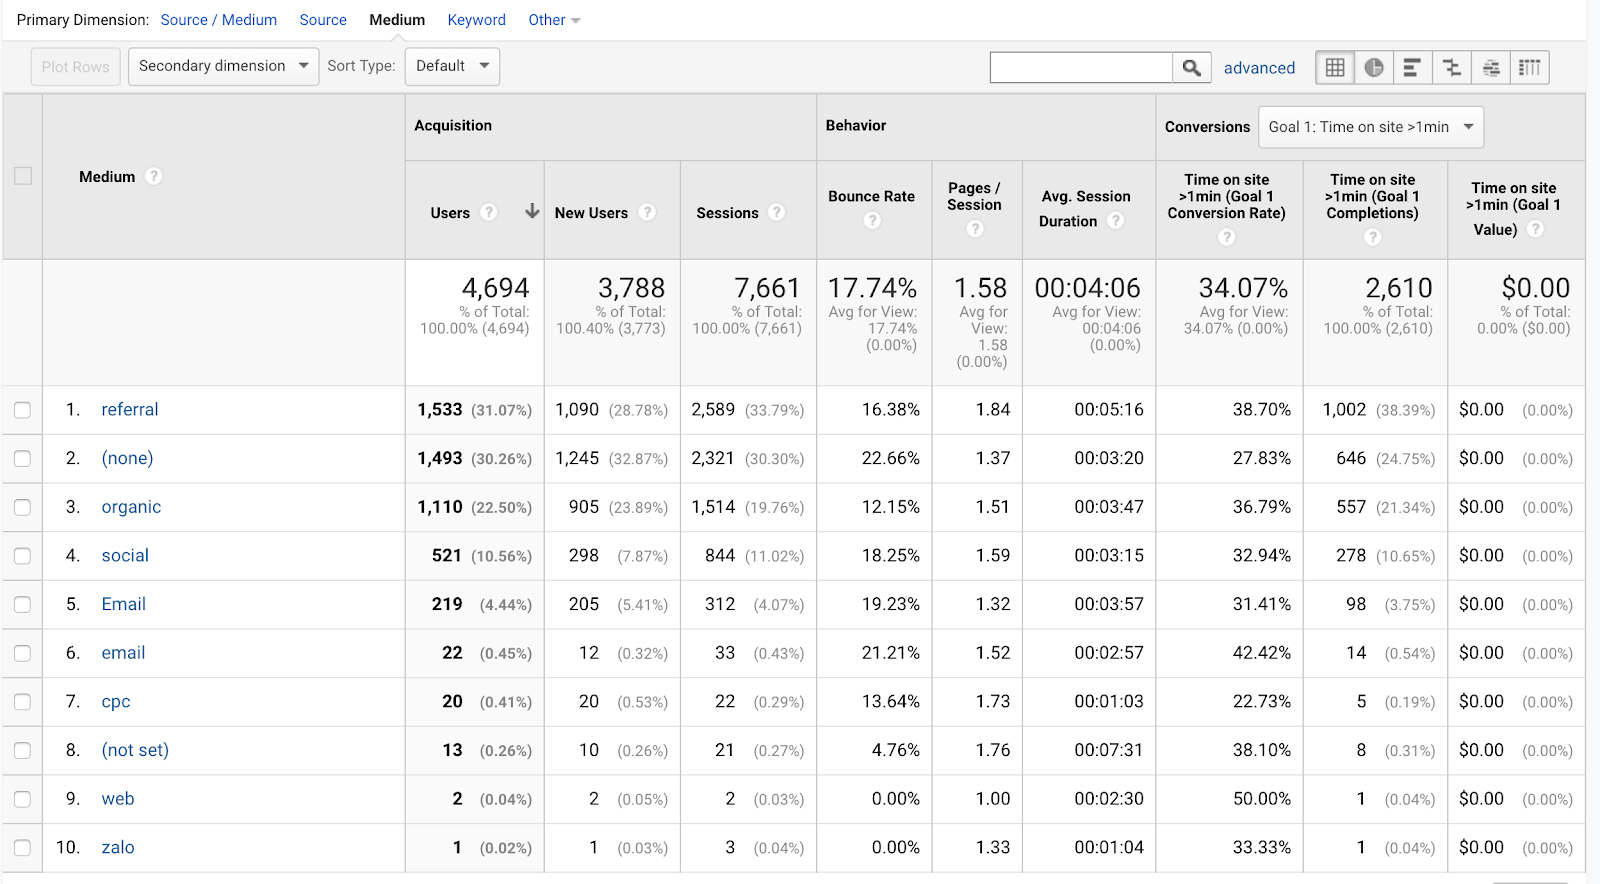
Comparing this to the Medium report in Universal Analytics:
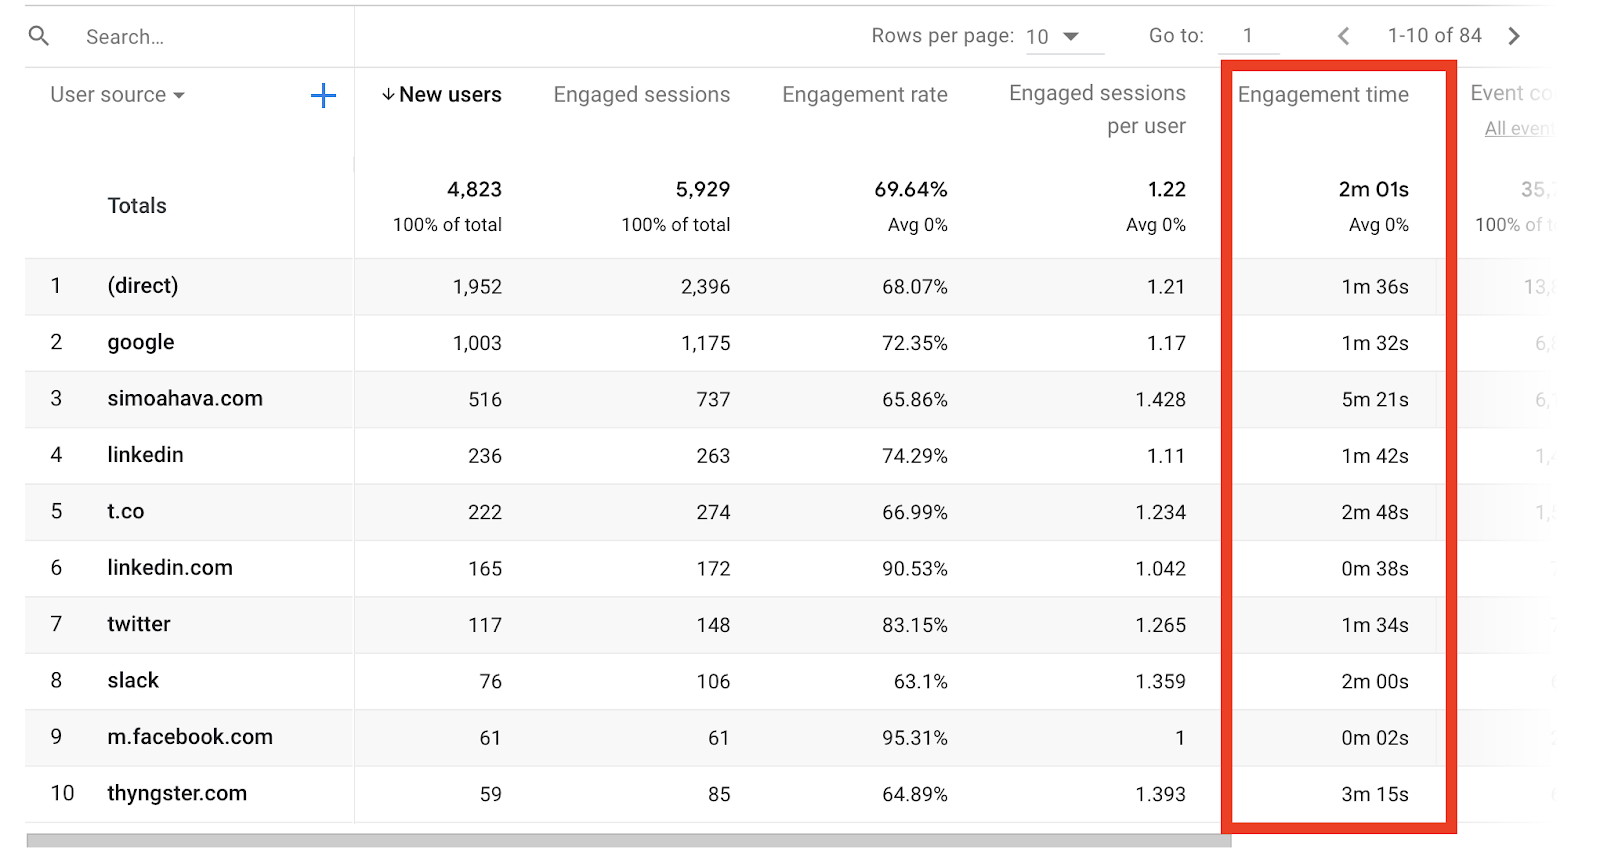
To change the dimension to view the Source report in A+W, choose the dropdown selector on the top left of the table to choose ‘User Source.’ As you can see highlighted, ‘linkedin’, ‘twitter’, and ‘slack’ were from custom UTMs I attached to posts on those channels. For more info on why custom UTMs are important, check out my previous post on campaign tracking.
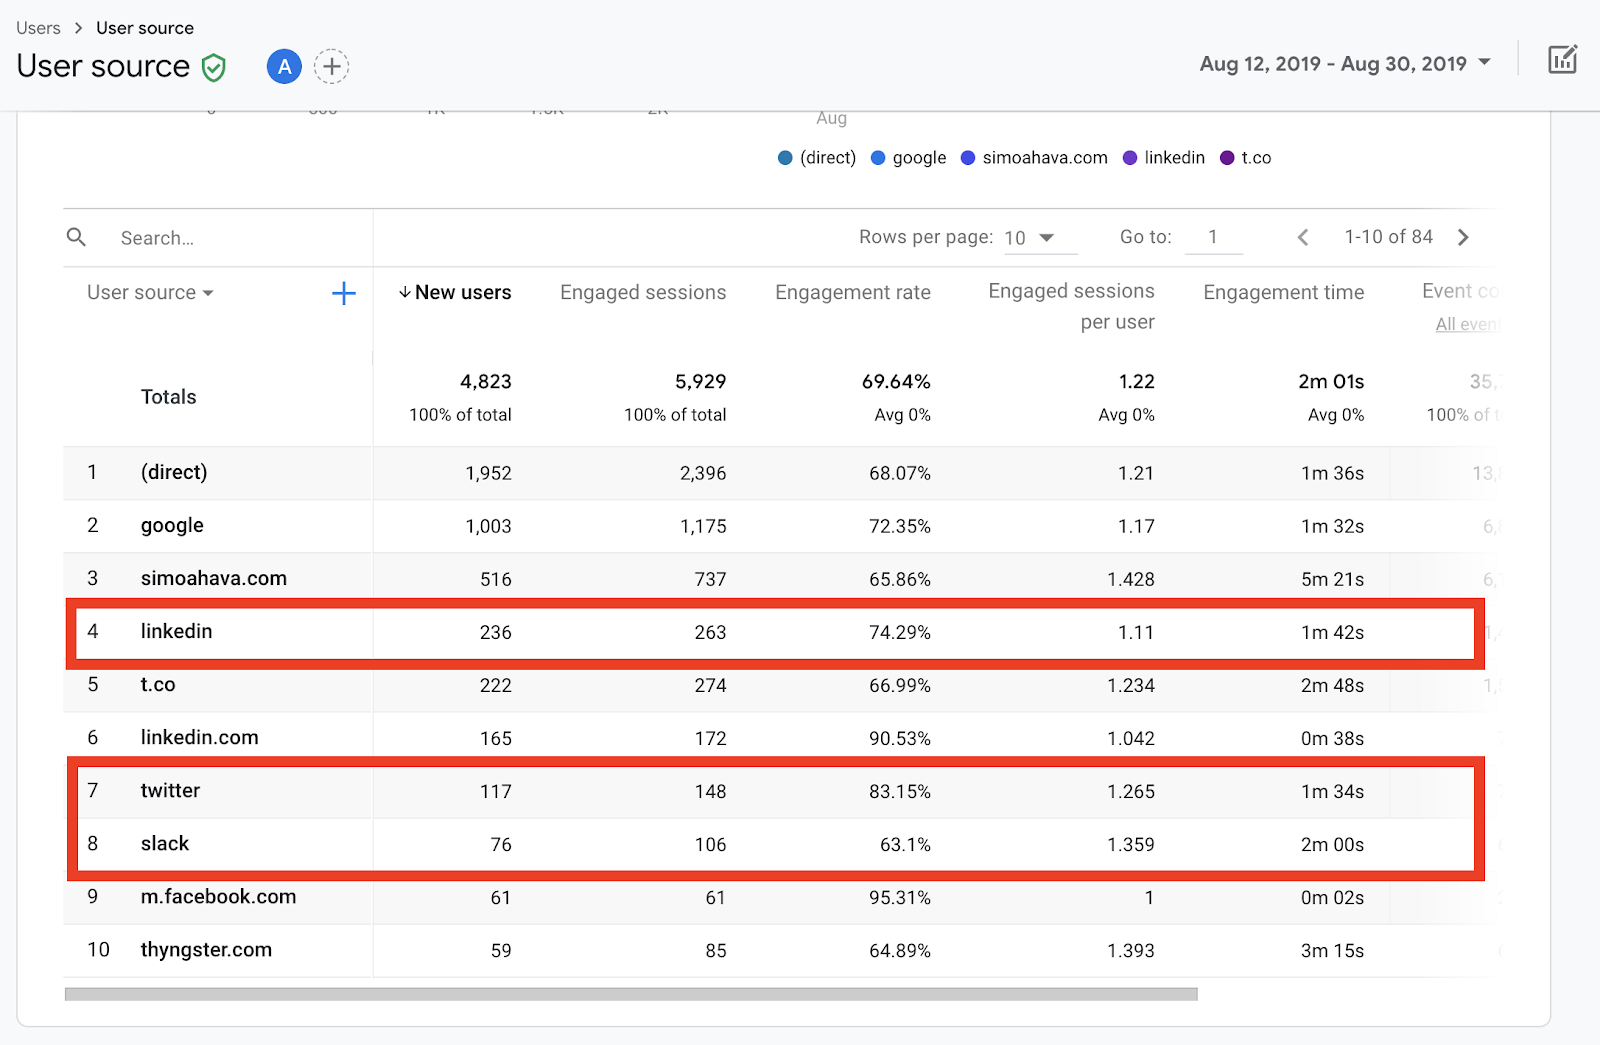
Here is also where you will see the ‘Engagement time’ metric I mentioned at the top of this post in action! Side note – traffic coming from simoahava.com is really engaged, thanks for the shout, Simo!
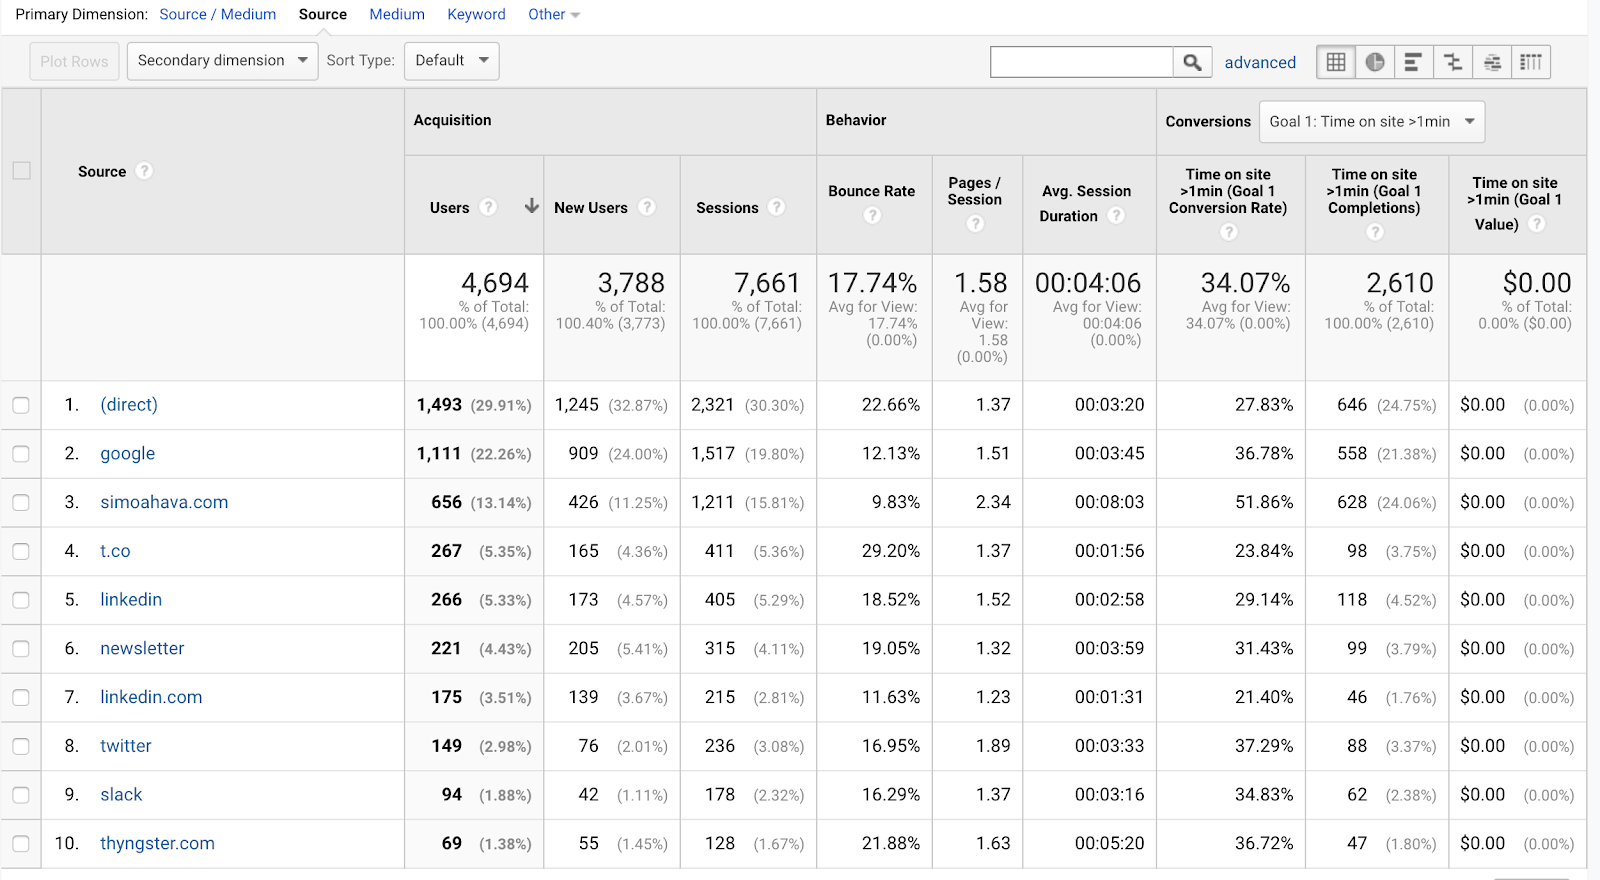
Comparing this to the Source report in Universal Analytics:
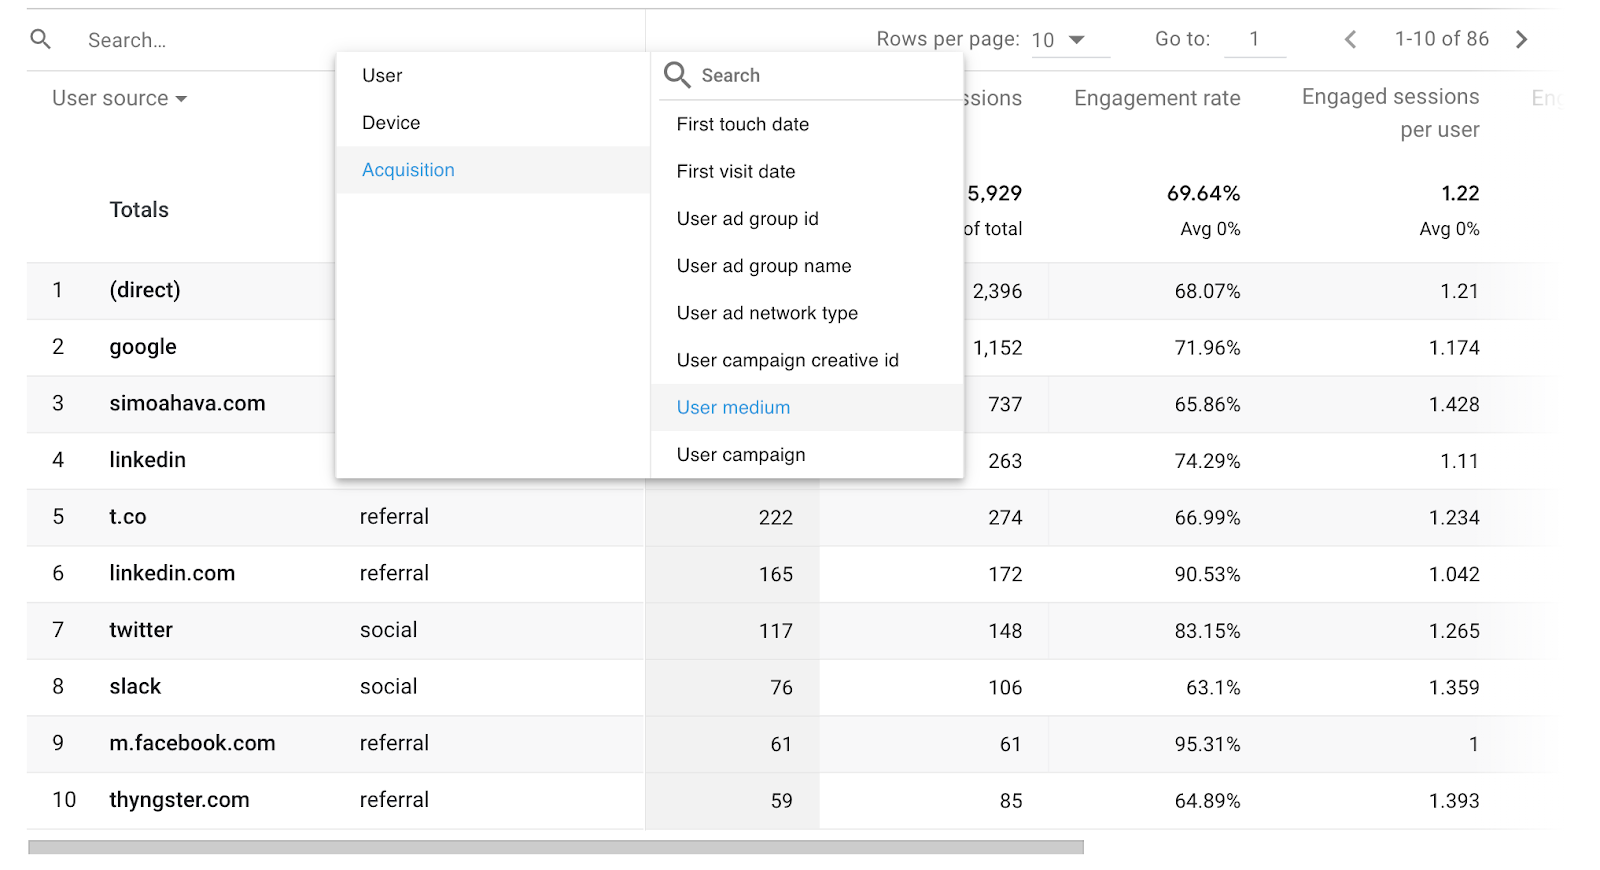
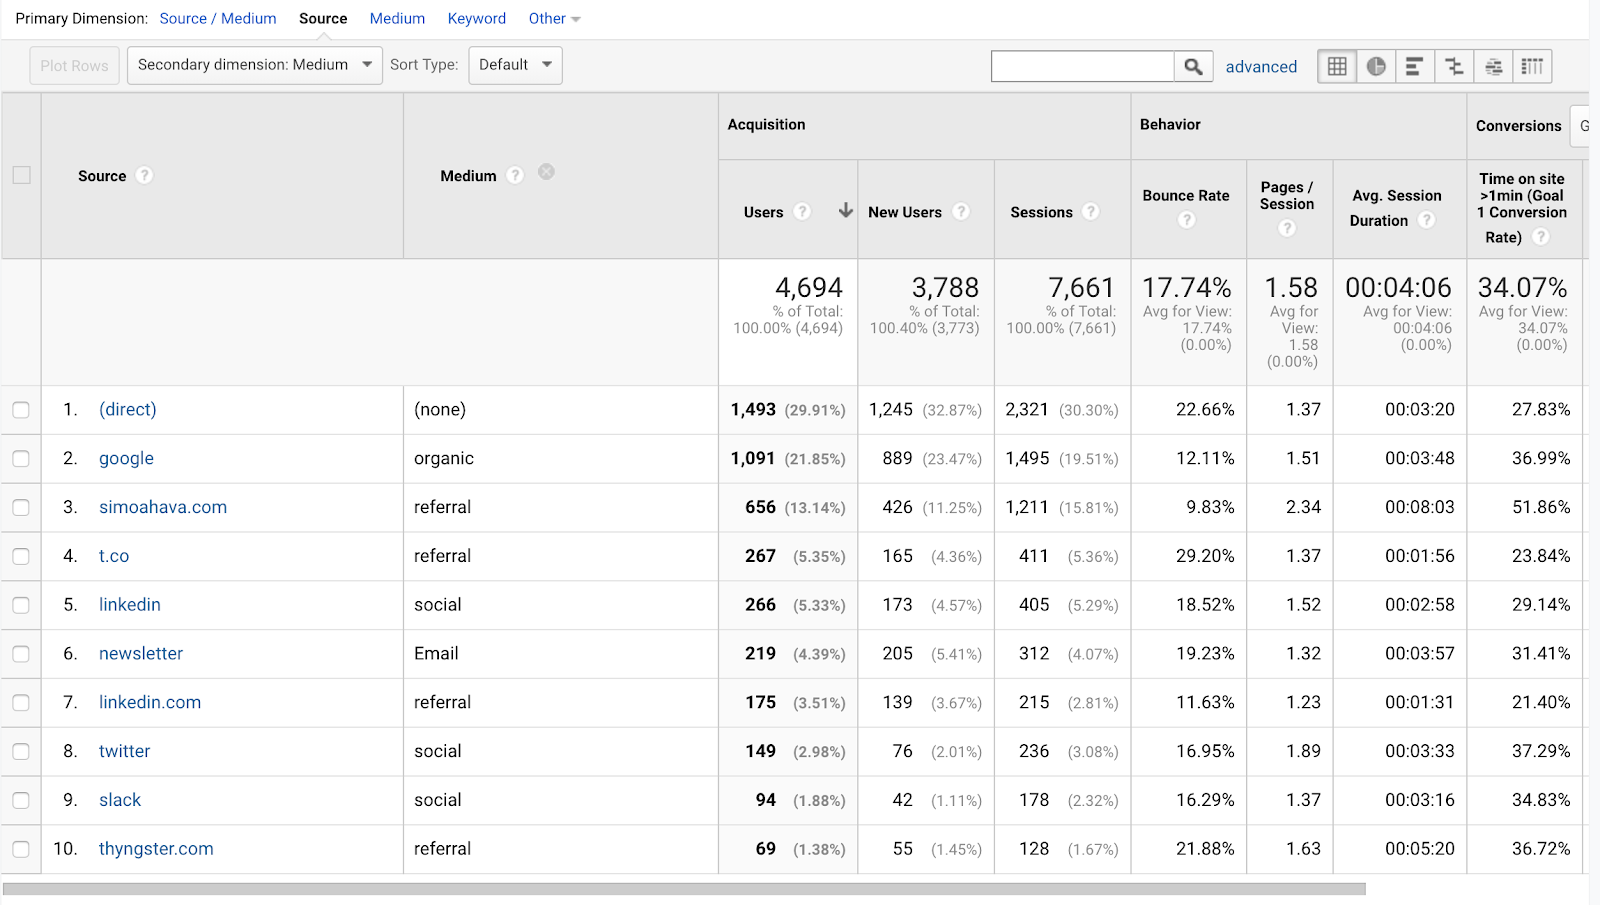
And now where the real value is, Source/Medium. As mentioned above, there is no out of the box report for this in A+W (yet!), but you can make it by using the secondary dimension capability. To do so, click the blue + icon next to the dimension picker dropdown, and select ‘Acquisition’ and ‘User Medium’ from the list to add this as your secondary dimension:
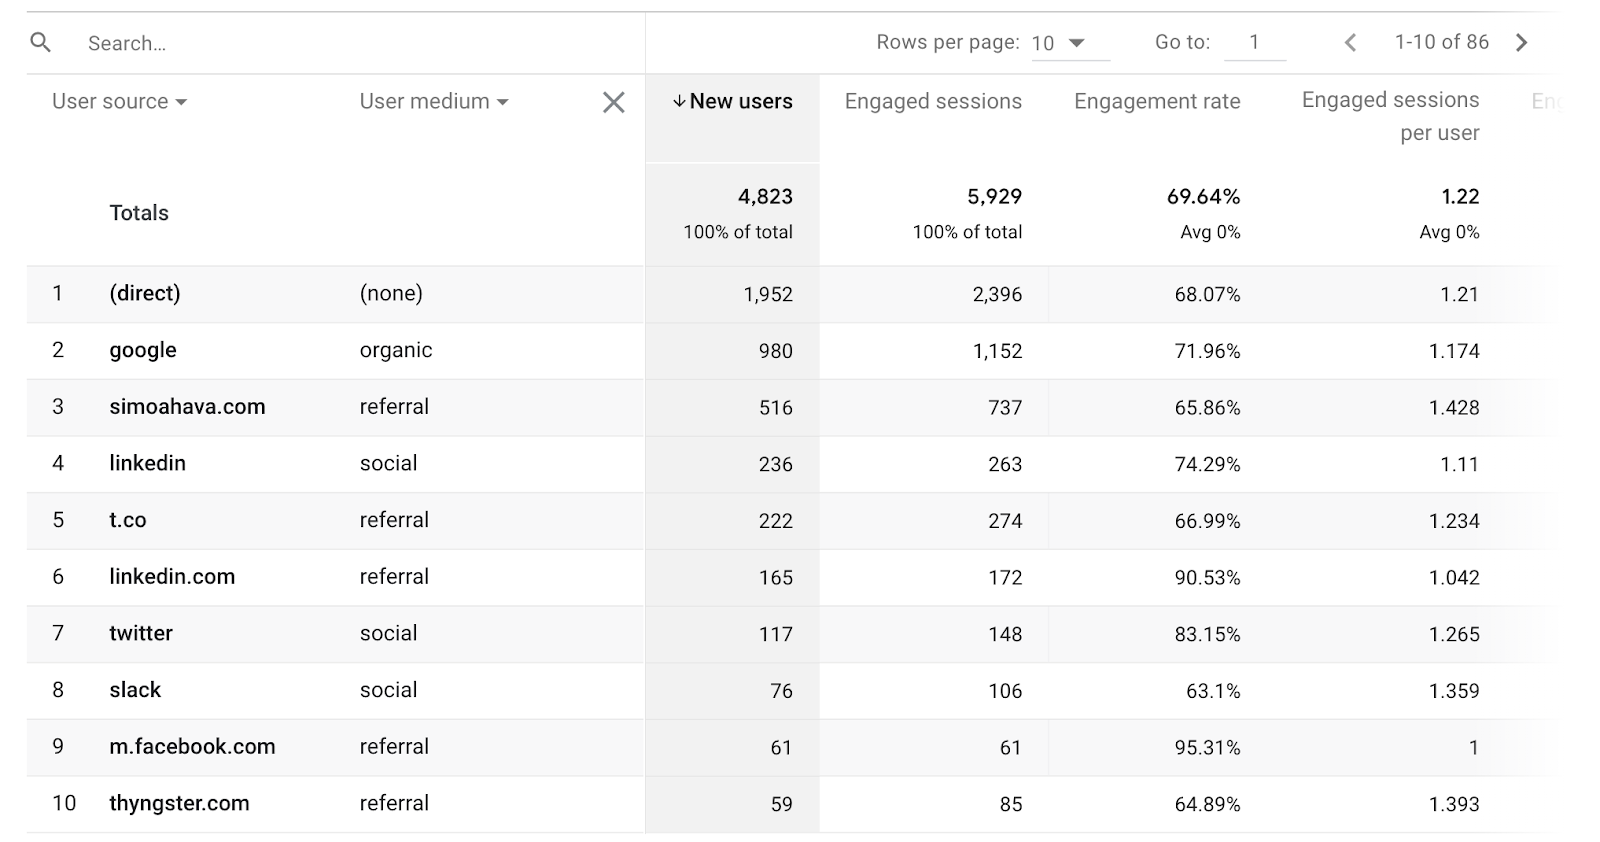
This will give you the following report:
Comparing this to Universal Analytics, I can make the same report with two dimensions, or just use the Source/Medium report on its own:
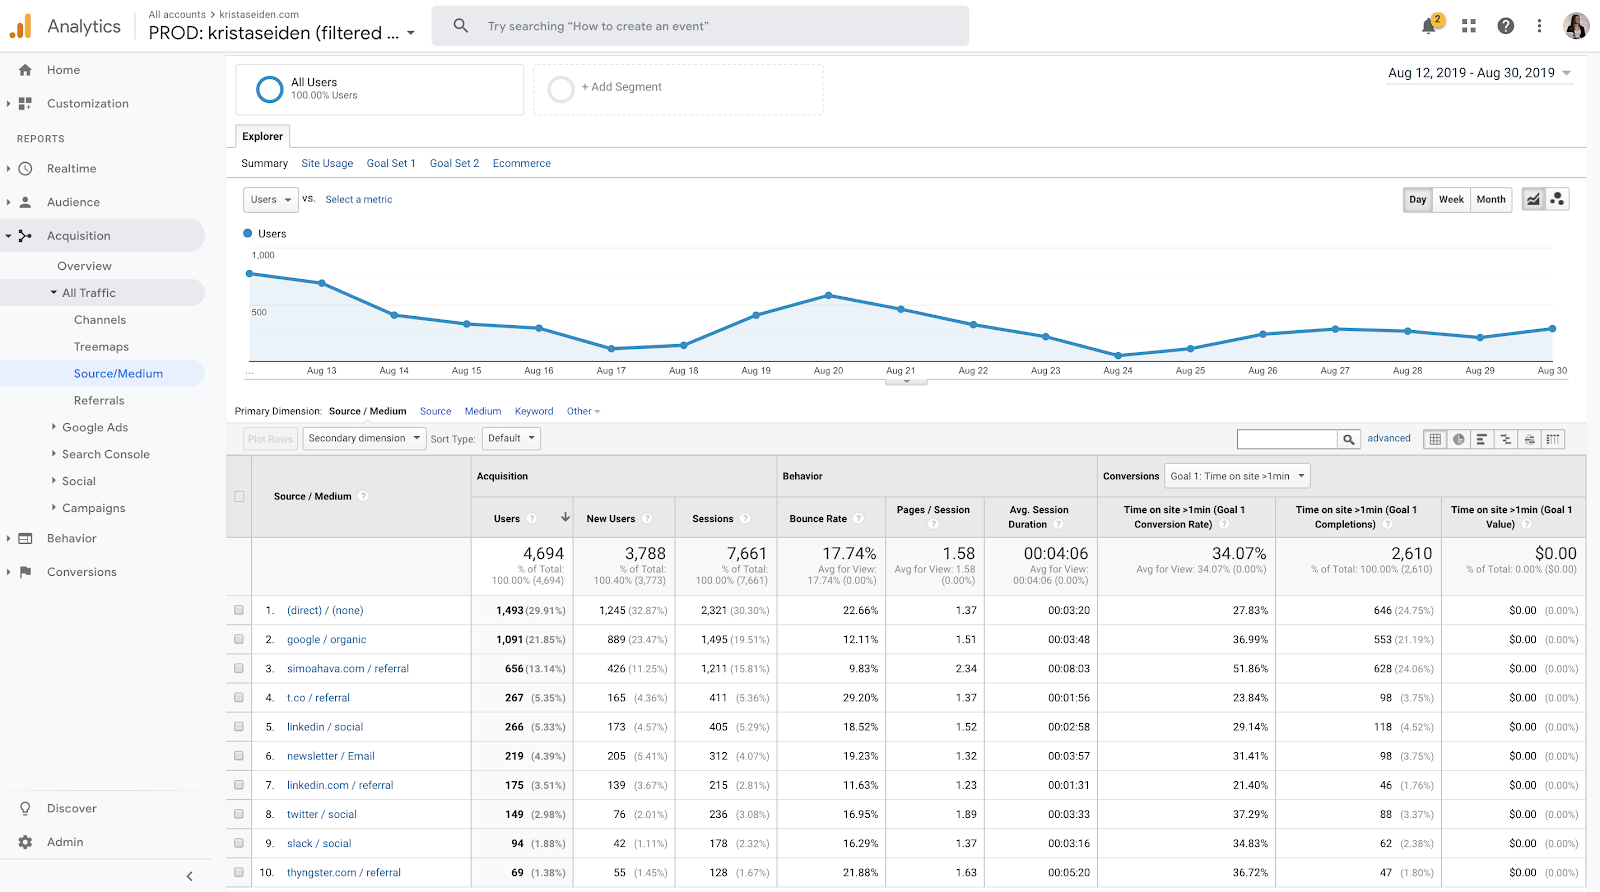
As you’ve probably noticed, the numbers don’t quite match for the same time period of Aug 12 – 30 in these reports (screenshots last updated Aug 31). As I mentioned from the get go, the data models are different, so I’d suspect some difference. The gap here isn’t that large (within 3%) so I’m not too concerned, but will be tracking this over time to ensure data continues to track in line.
One last gem I want to leave you with: In the upper right hand side of most reports, you’ll see a small icon that says ‘Customize report’ on hover.
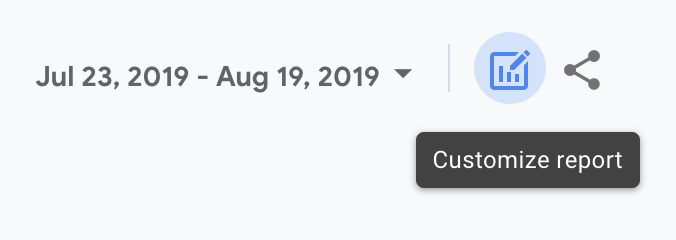
This icon allows you to customize a report with comparisons and other details, essentially some in report editing/customization of the out of the box/canned reports you get in the reporting UI, and then save. I suspect these save actions will then lead to some sort of bookmark option, though that isn’t yet enabled, so we’ll see!
This post has gotten rather lengthy so I’ll wrap it up here, but as you can see, there is a lot to cover in the new reporting in App+Web, and I suspect many improvements still to come. Can’t wait to see how these beta reports progress!

TSE
Hi Krista. I have a question about the difference between two ‘engaging’ concepts in A+W
One is [reports > user > ‘engaged sessions’, ‘engagement time’] which removes bounces from session counts and precise measurement of the session time as you said from post.
and the othe one is [reports > user > New user(or Audiences) > Customize Report > ‘Attribution type’ > Cross-Channel last engagement] (this one is also in ‘Anaylsis hub’ as a dimension). As far as i know, this ‘engagement’ concept is referred to as some kind of attribution criteria from the Firebase.
How can i distinguish these two type of ‘engaging’ dimensions? So confusing.
thank you
Krista
I believe the first one you mention is the last engagement, regardless of channel, and the latter is the last engagement de-duped for cross-channel behavior, so the numbers for the first should be higher than the second.
Pingback: Daily Search Forum Recap: September 3, 2019 – AdvertisSEO
Jon Whitehead
Hi Krista
Have an odd issue with platform filtering
Firebase reporting in GA – What is your platform breakdown? report
Shows iOS users 1666 Android 330
Add iOS and Android filter (ie web excluded)
Users change to iOS 2329 Android 445 for same time period
Venn diagram shows Android and android, iOS and ios (notice case difference)
Looks like ios and android not included in overall reporting, only when platform filter added
Is this a bug? a change in firebase tracking since adding web and app reporting?
There are screenshots at https://support.google.com/analytics/thread/14664303?hl=en
Bartek
Hi Krista 🙂
Can we check in GA A+W how many users from mobile devices installed and opened the app?
Krista
You can check on a first_open, but not on an install. First_open is the metric that would most closely resemble this.
Nathan Corliss
This is the only article I could find that defines “engaged sessions.”
Google analytics help documentation doesn’t even have a definition.
Thanks for writing this!
Nate
Head of Marketing for the FatCoupon App and Website