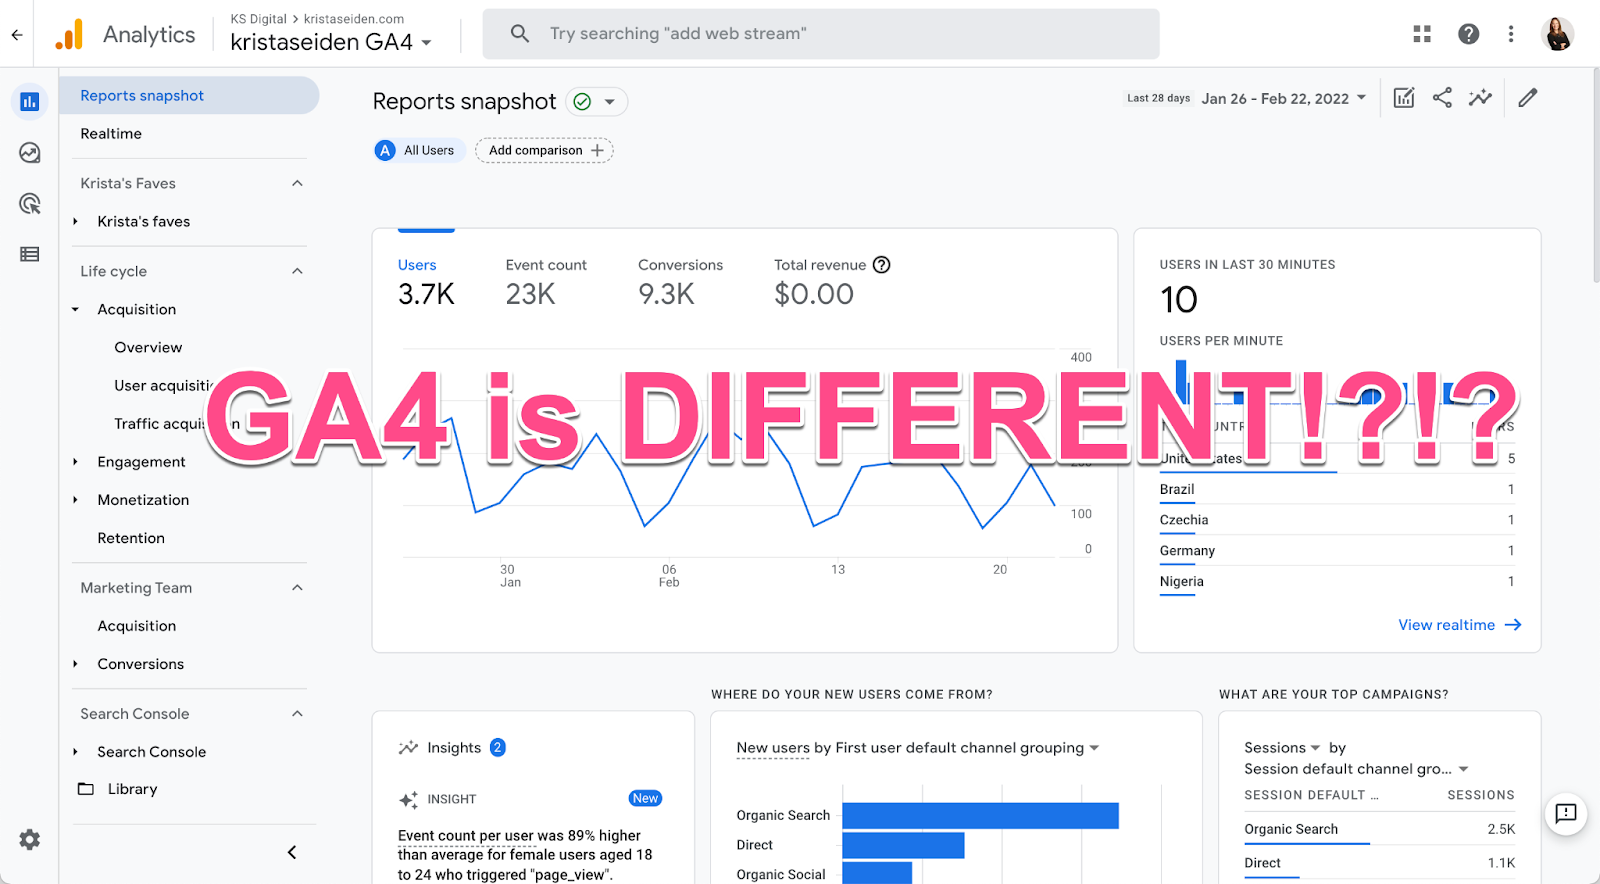
Google Analytics 4 (aka GA4) is so different (looking & acting) that it can be really overwhelming to start digging in. So here are 5 quick tips to help you feel more comfortable and better use GA4.
Tip 1: Make the reporting UI work for you!
For the first time in GA history, GA4 allows you to actually modify the UI, both the reports themselves and the left nav organization of reports. This means you can do things like build out report collections for specific teams so they have a clear place to go for their reporting needs. Here you can see a collection of my favorite reports:
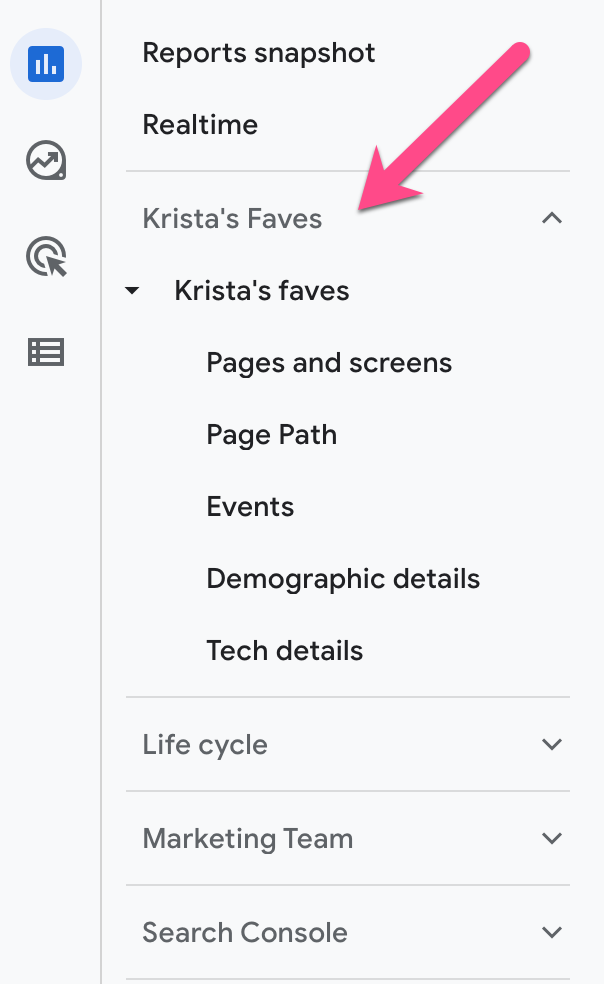
You can do these modifications yourself by navigating to the “Library” section of GA4 (bottom left hand nav when you are in the “Reports” section). You’ll need to be an admin on the account to make these changes.
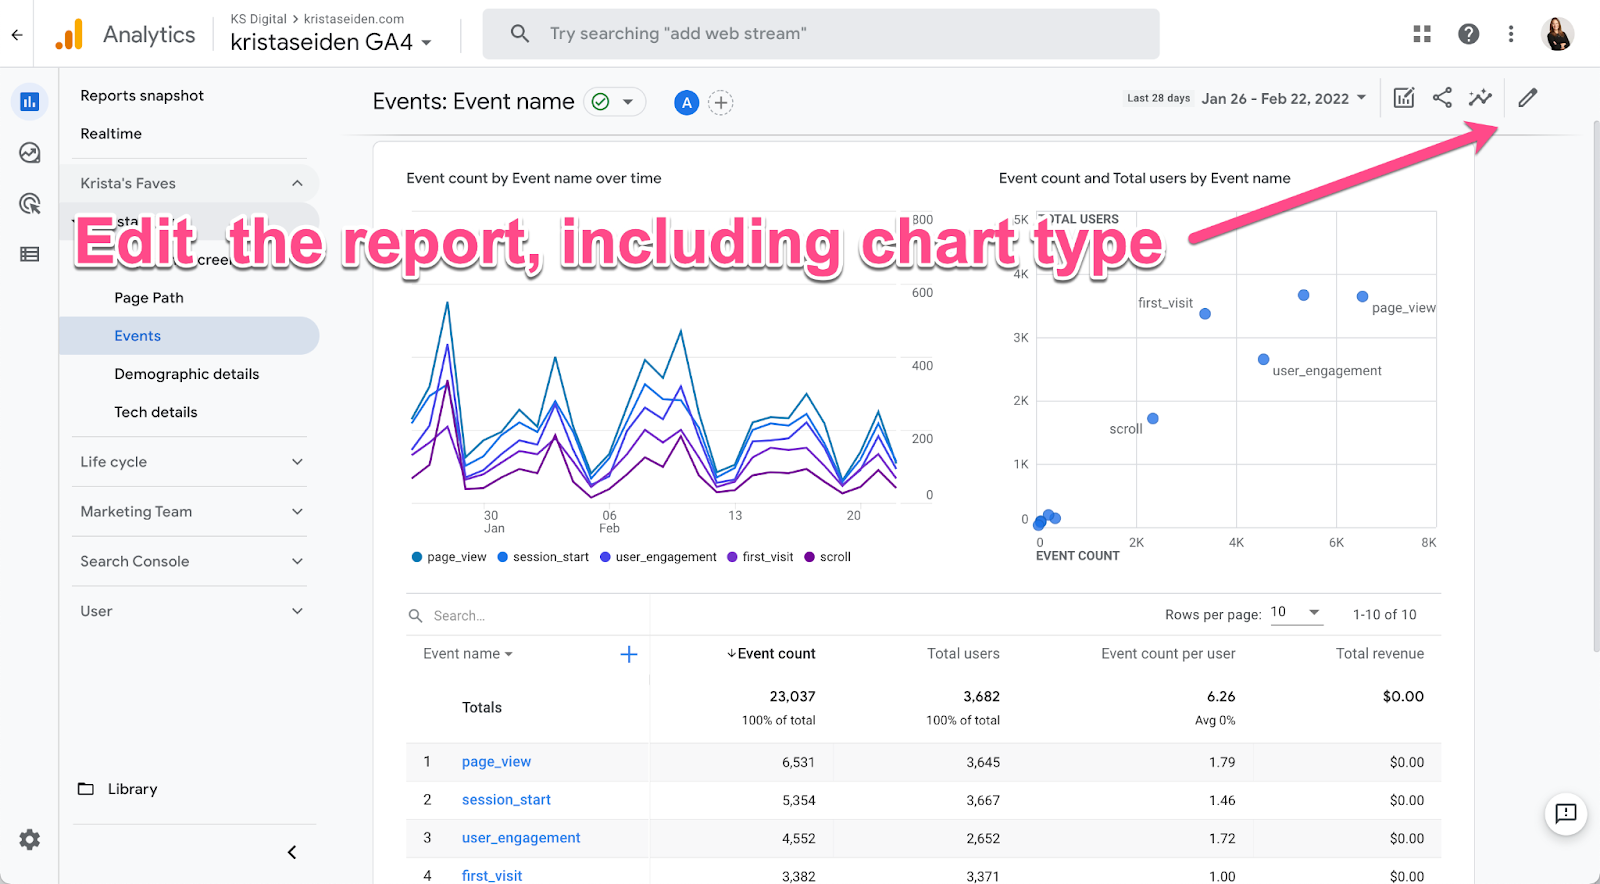
Tip 2: Choose your favorite graphs
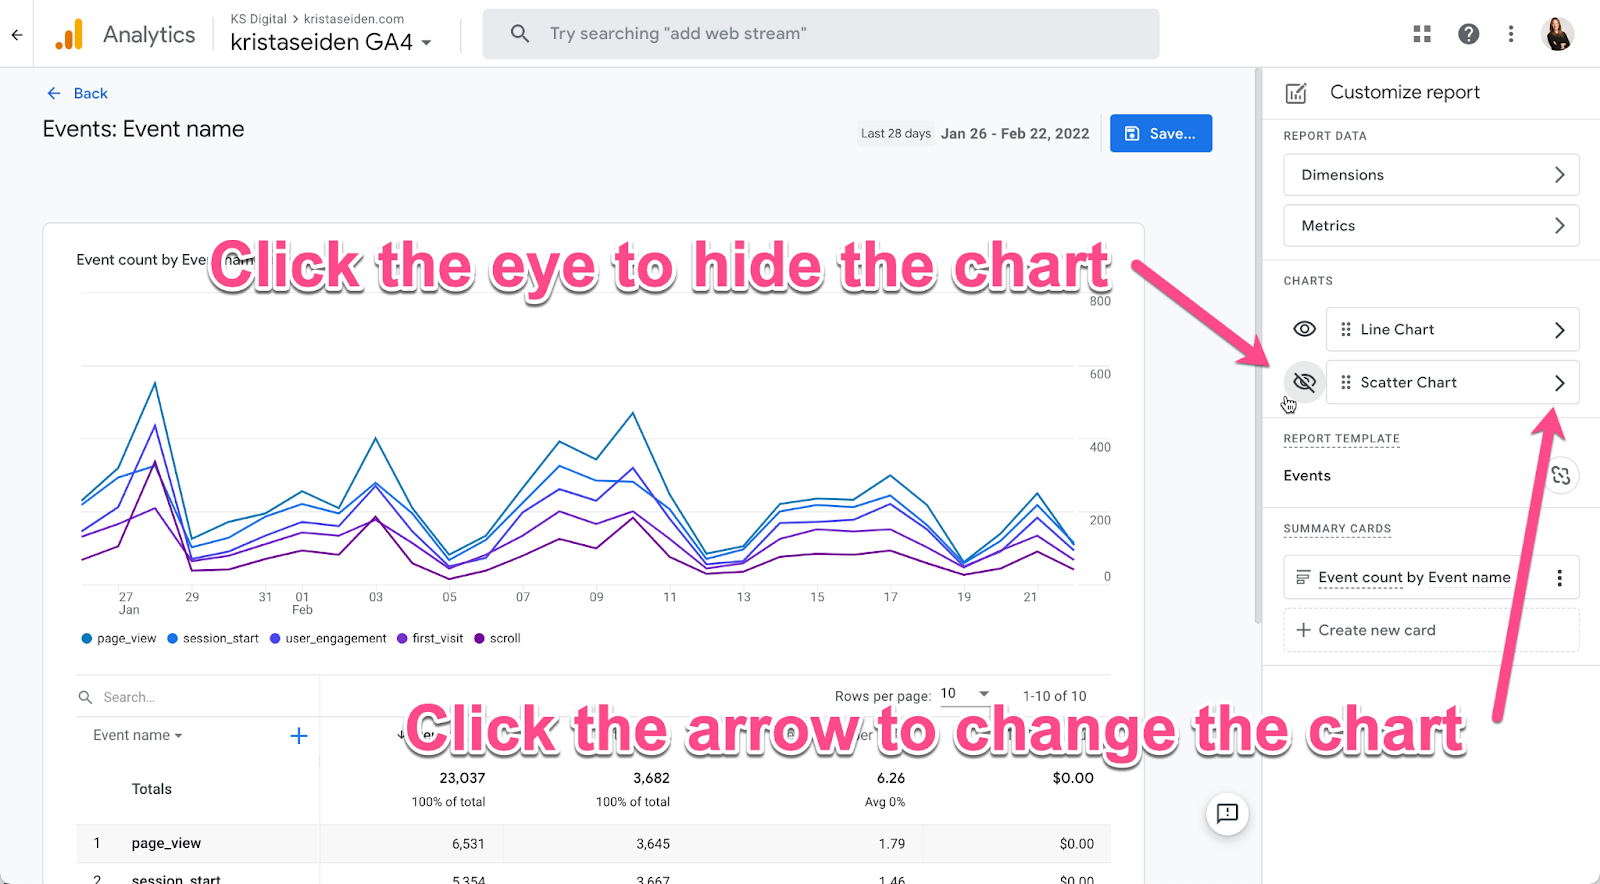
In GA4 reporting, you can change the chart type on each report. Out of the box, each table report comes with either a line chart of a bar chart, AND a scatter plot. I’m not a fan of the scatter plot, so I either change or remove it.
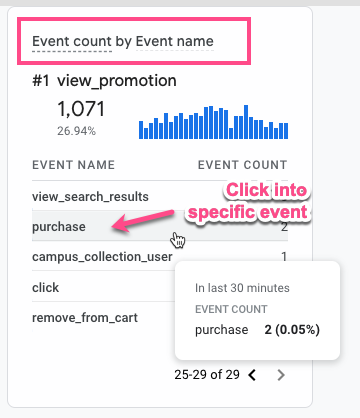
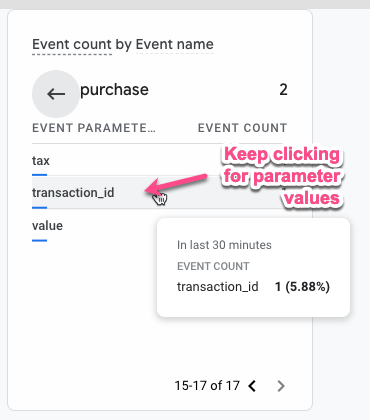
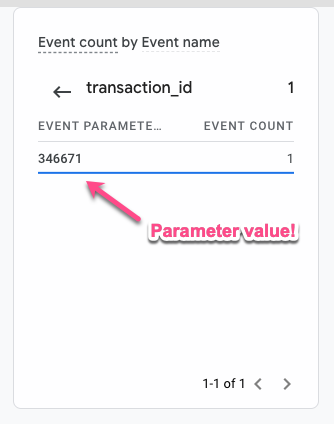
Tip 3: View event details (parameter values) in Realtime reporting
I bet you didn’t know that you can click through into event parameter details in the Realtime widget for Event count by Event name! This is great for real time debugging, or just to see more detail as it comes in. More here in the full blog post.
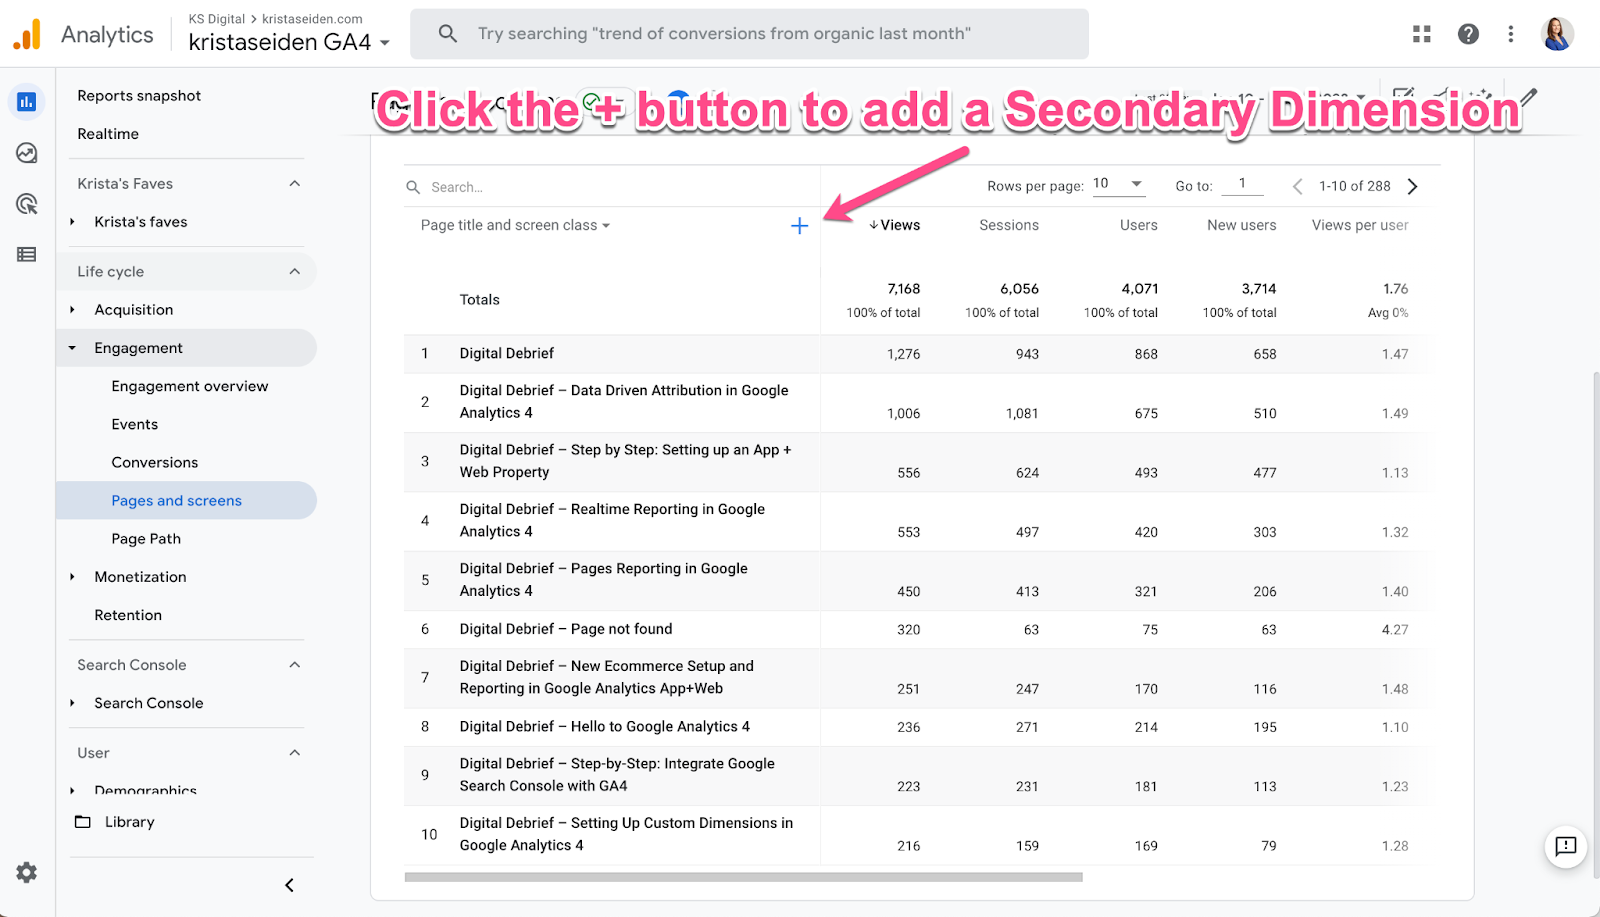
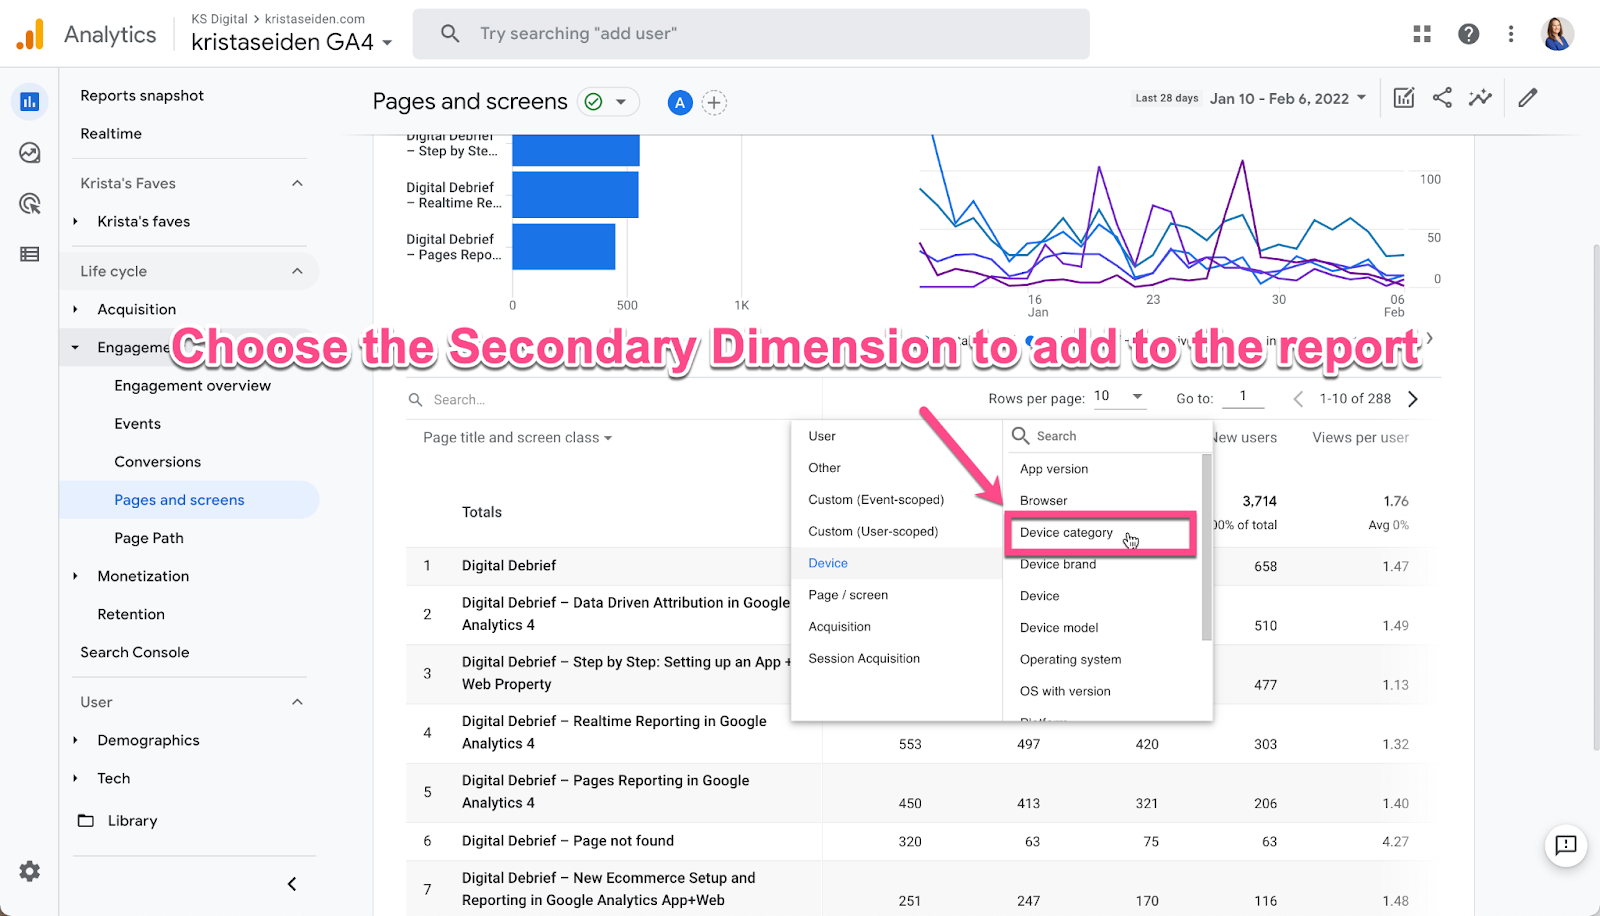
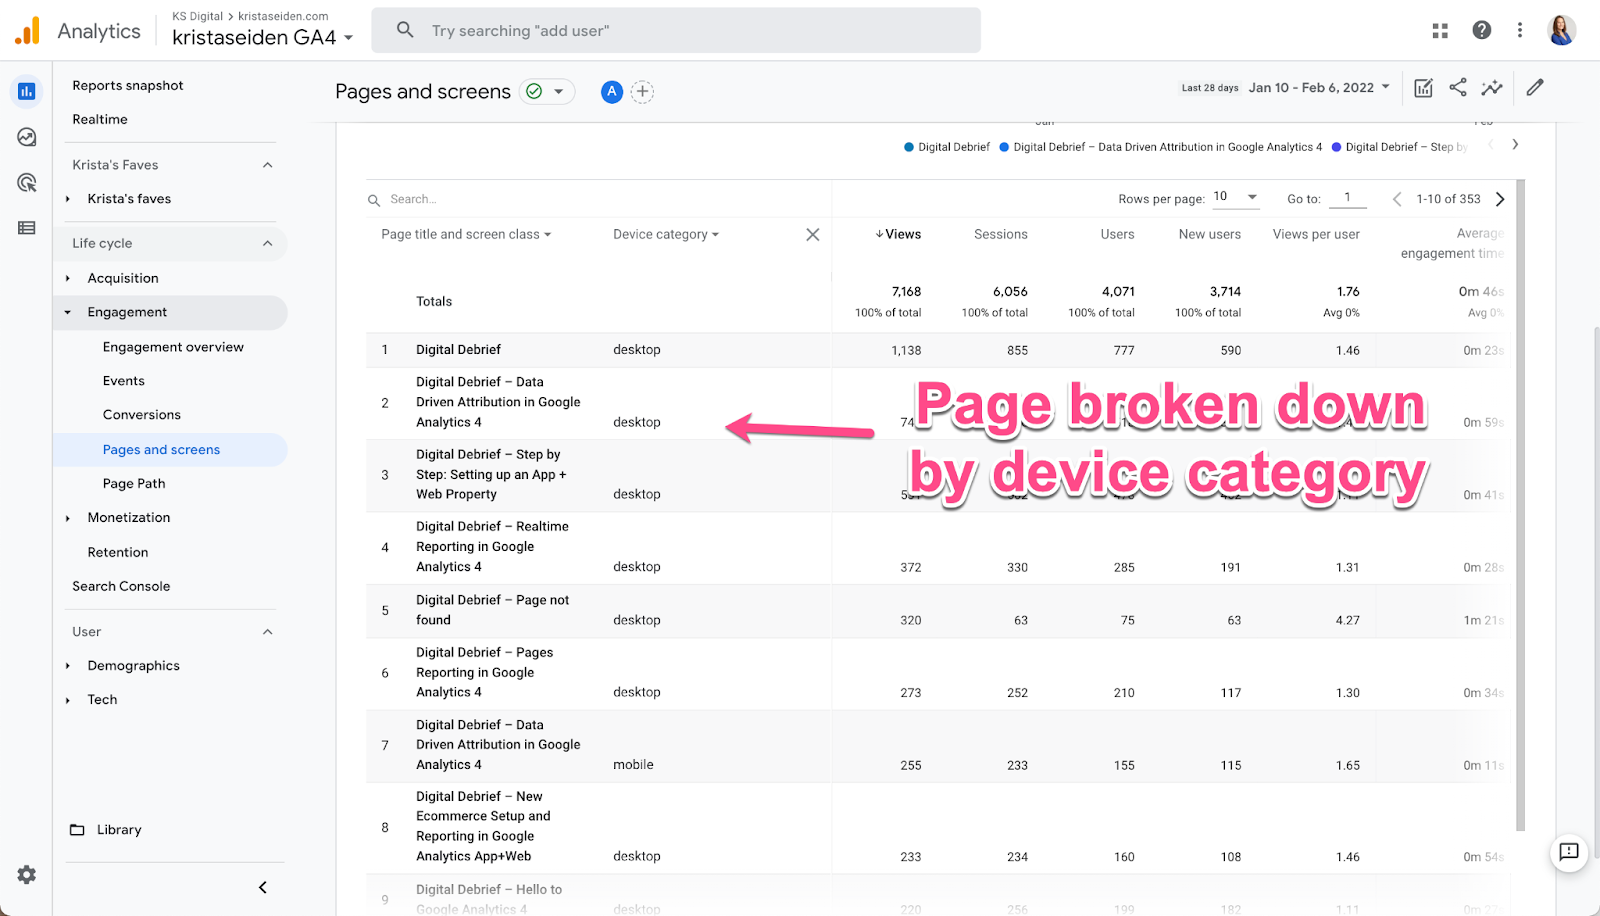
Tip 4: Dive deeper with Secondary Dimensions
Take your analysis to the next level using Secondary Dimensions to breakdown each row of data in a table. For example, I could breakdown the Page by the device category someone visited the page by. More here in the full blog post.
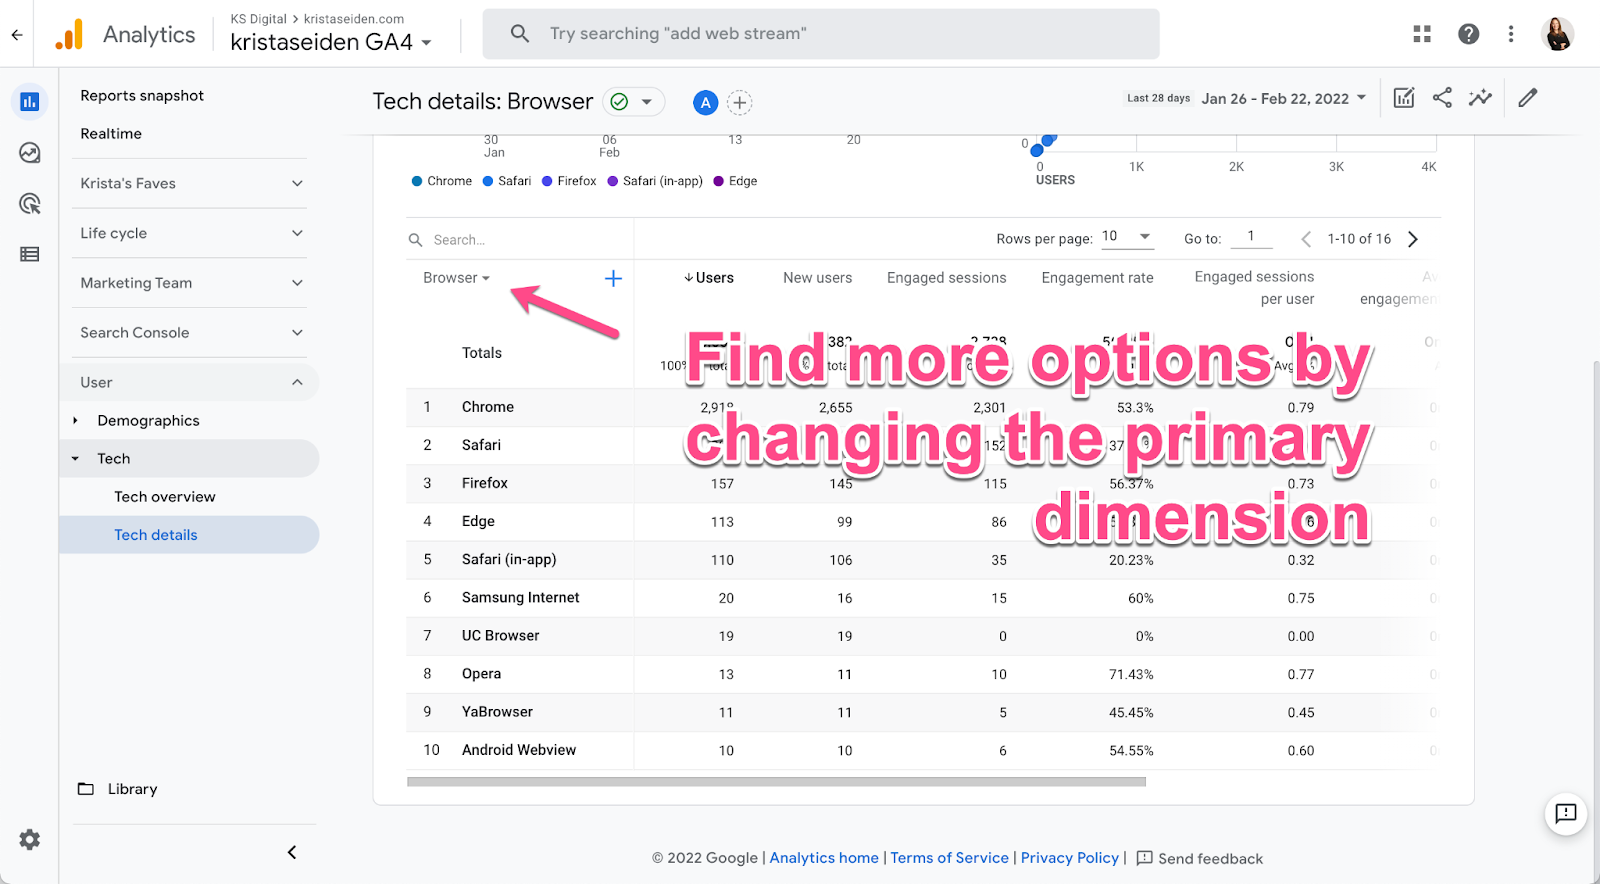
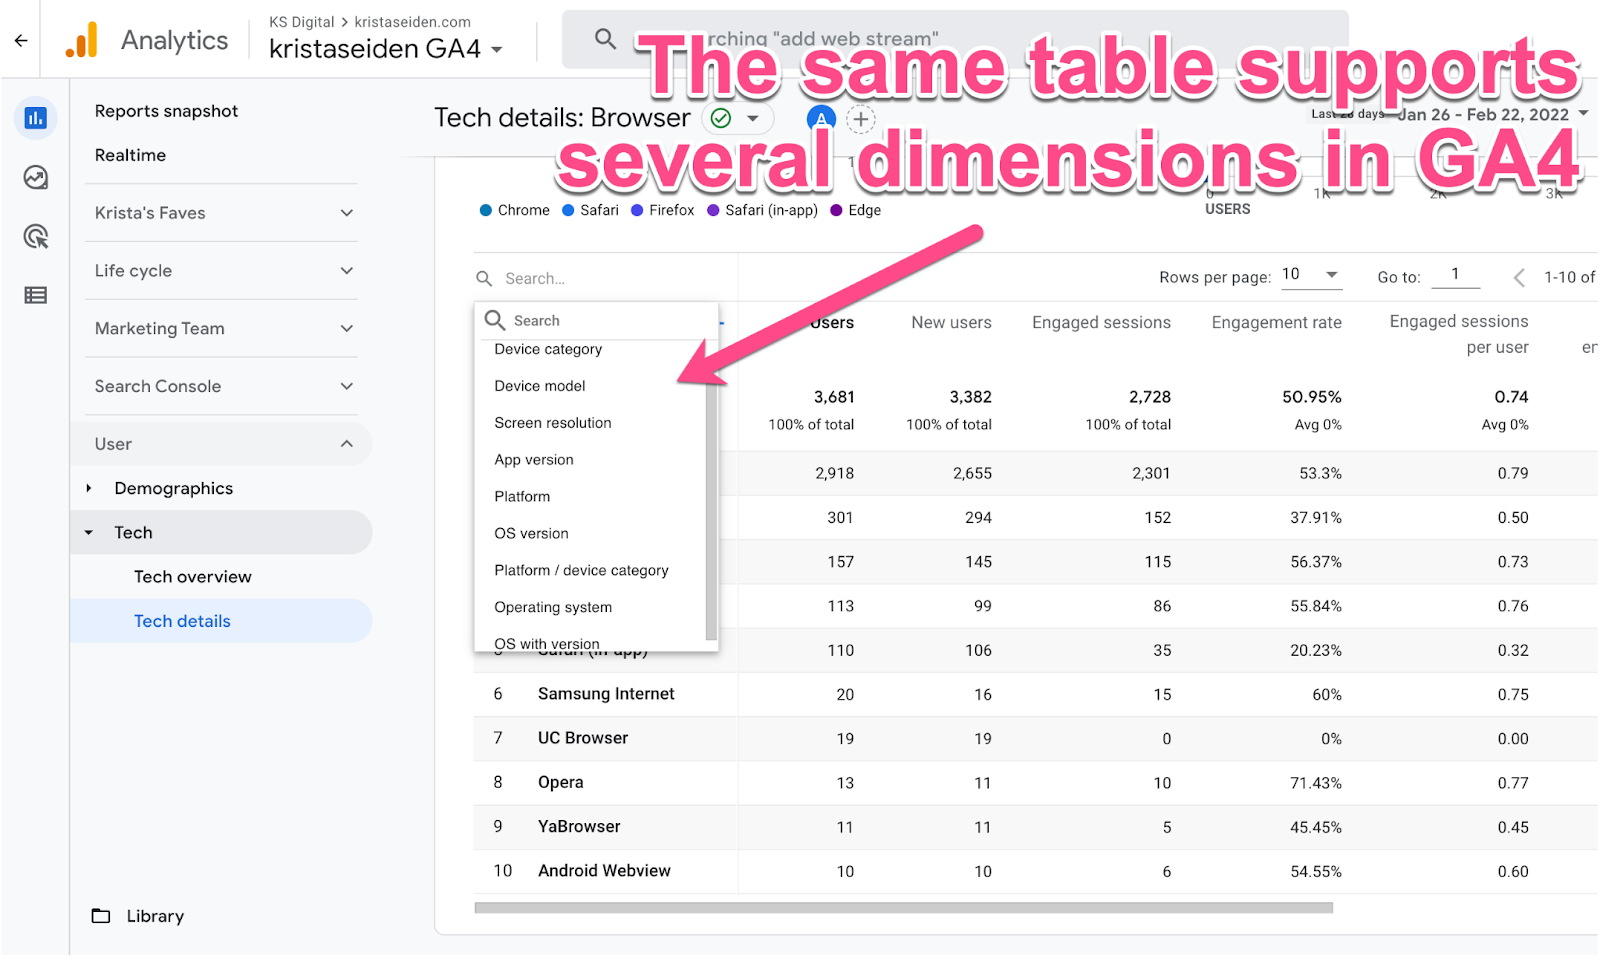
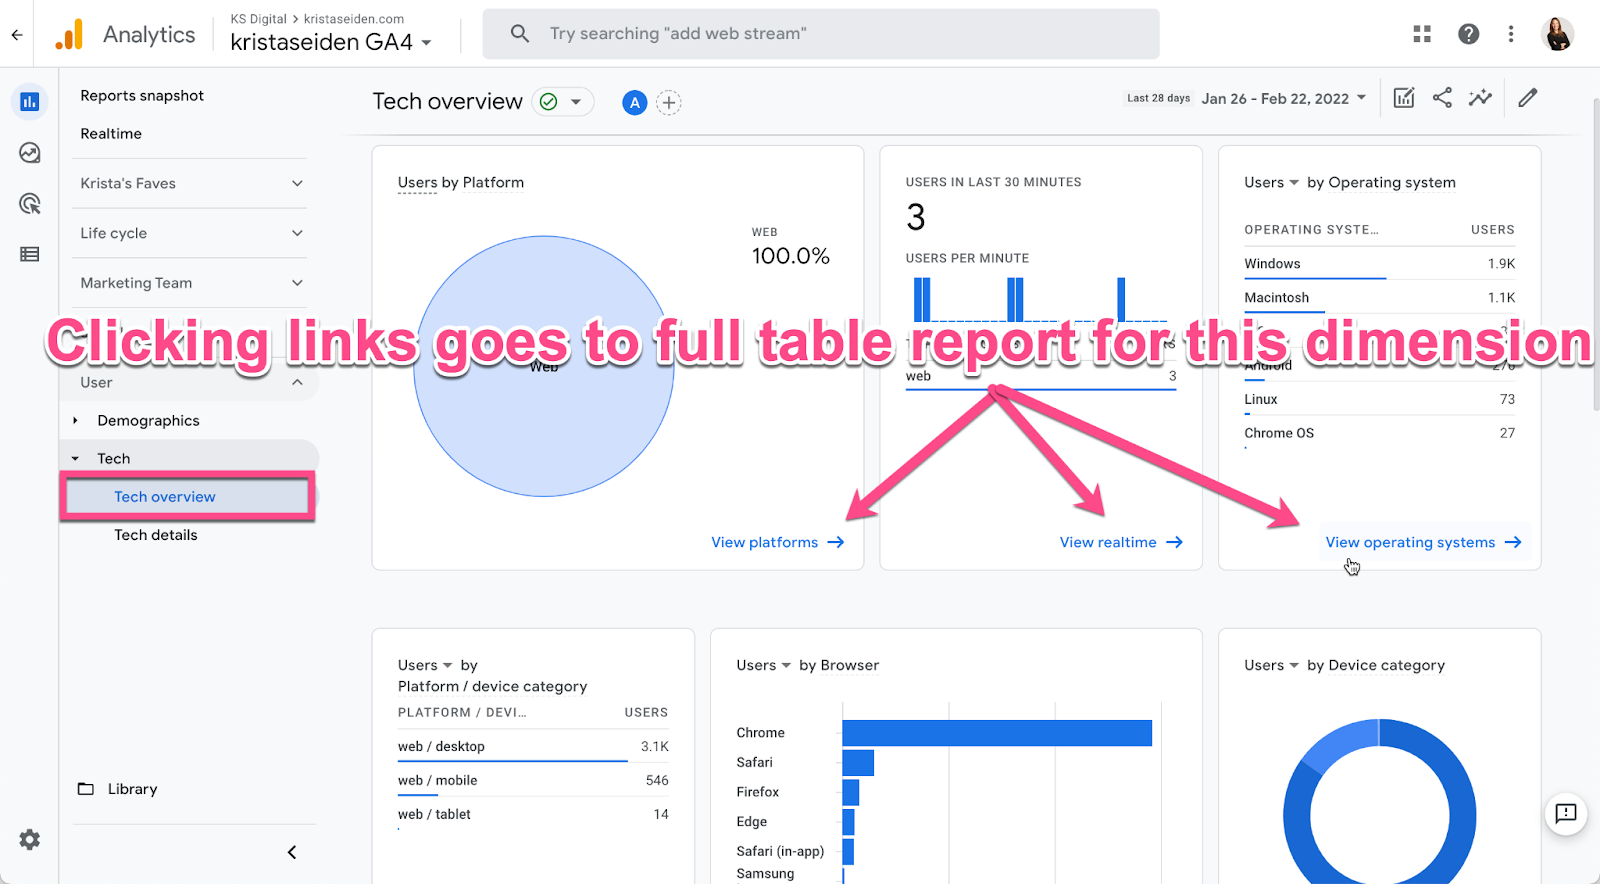
Tip 5: Details are hidden, but they’re in GA4
In Universal Analytics (aka GA3), there were a TON of report options where you could choose several different dimensions to focus on. For example – the technology report had so many dimension options! On the surface, GA4 looks sparse… but you can find more dimension options in each table report and by clicking through widgets in any of the Overview reports.

This blog post was inspired by the Twitter thread of the same content. If you’ve learned anything from this post, or want to hear more from me about #GA4 and digital analytics on Twitter, please consider giving me a follow @kristaseiden.
You can also join my newsletter where I send out Quick Tips videos about GA4, analytics industry updates, and news about KS Digital course offerings 1-2x/month here: https://ksdigital.co/stay-in-touch/
2 thoughts on “5 Quick Tips to help you better use GA4”