Data Driven Design
Designing a new website is a big task. You must take many things into consideration: ease of use & functionality, mobile responsiveness, content, flow, graphics, etc. On top of that, you need to ensure that all of the analytics tracking is properly setup and collecting the necessary data for you to report on success.
With so many considerations, it’s important to look at what your users are already telling you about it’s ease of use and helpfulness before you begin to make decisions about how to redesign and change it.
Key metrics to consider when thinking about a website redesign:
– number of unique users & sessions in a given time period
– top content by pageviews/events/goal conversions/etc
– funnel success (newsletter signups, contact form submits, checkouts, etc)
– device type (mobile, tablet, desktop)
– bounce rate & time on site (but remember my cautions for these metrics)
I’m a big proponent of data driven design, meaning, testing your way to a new website design piece by piece. I’ve done this in several organizations I’ve worked in and wanted to share one particular case with you here.
When I ran the analytics & optimization team for Google for Work, one of my biggest projects was building and leading an optimization program that scaled to 50+ tests per quarter and ultimately led to a 30% year over year bottom line improvement for a single product line.
As we scaled testing, we saved a percentage of our traffic and testing bandwidth each quarter to specifically test elements that we intended to change in the next version of our website. This included testing real life vs cartoon imagery, headline variation, calls to action, site layout, pricing information, targeted messaging and more. As our design teams worked on what the new site would look like, we partnered to ensure that each element they wanted to change was done so in a data driven manner.
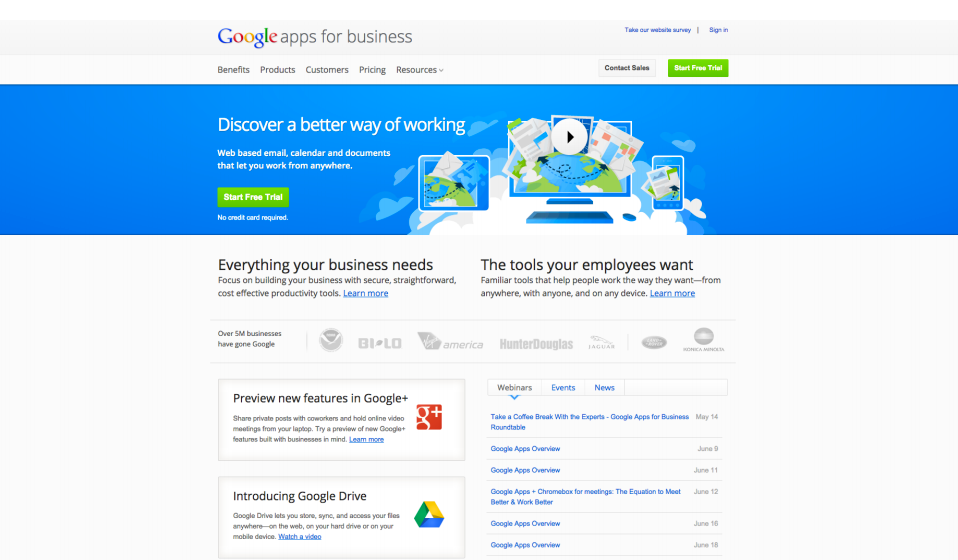
In September 2012, when I joined the Google Apps for Business team, this is what their website looked like:
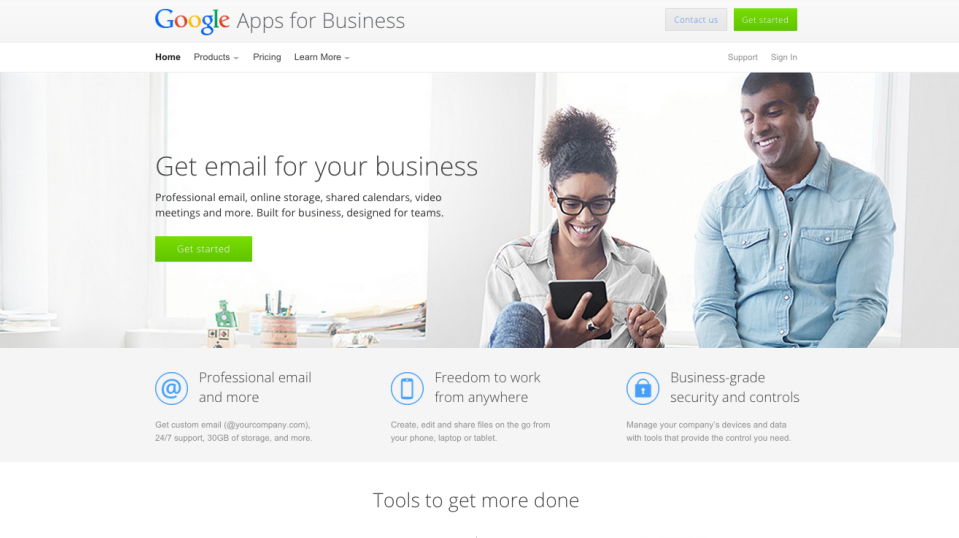
In September 2014, when I left the Google Apps for Work team, this is what their website looked like:
To get there, we tested. A lot. Over 2 years we ran:
– 453 unique variations
– 159 unique tests
– in 25 locales
– on 4 product lines
– resulting in 50+ key learnings
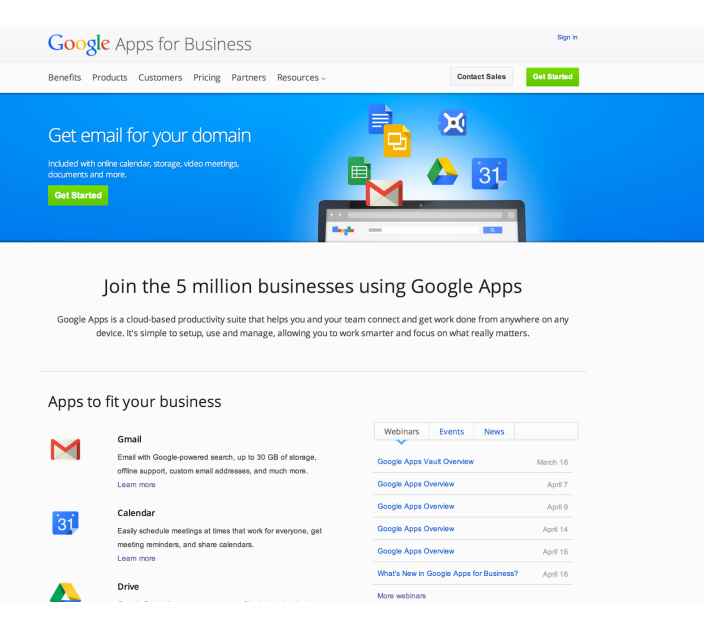
By February of 2014, after 1.5 years of focused testing on the old Google Apps for Business website, we were at a pretty optimized place for the website we had, the result of which you can see below:
We packaged up all of the individual learnings from things such as CTAs, headlines, button color, solution messaging, and more to create the new version of the Google Apps for Business website that you see below:
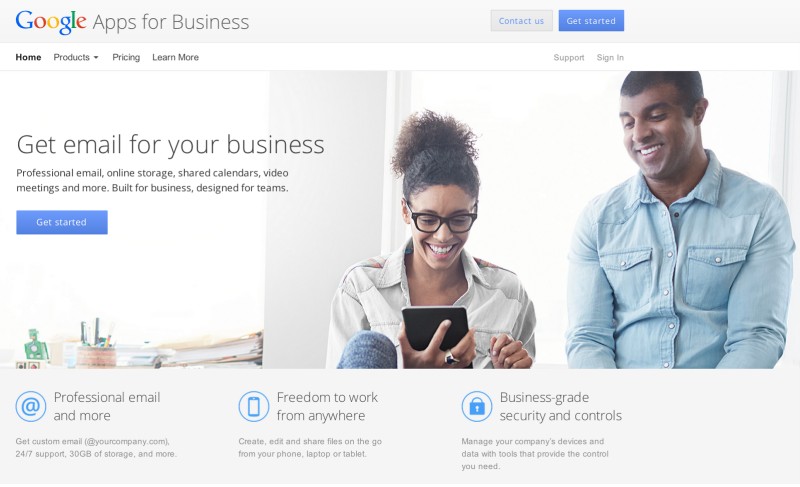
And then we tested them against each other. After a few follow up tests and tweaks to the new design, we had landed on a fresh new website that performed as well, if not better, than the site we had spent 1.5 years optimizing, and that was in large part because we built in all of those learnings into the new site.
Launching a completely new website can often times have a flat to negative impact on business metrics due to the drastic change and often not optimized important features/messages. Designing based on a data driven approach will help you to build the best websites and solutions for your users, while also ensuring that you are putting your best (most optimized) foot forward for the business.
Happy testing!

Fabiola Martinez
Thank you for sharing your advice Krista! And most important, your journey, now I know who is behind the new design of Google Apps, no kidding, when the update took place Google made me smile, it was a nice surprise. Testing and optimizing is a never ending journey. All the best!
Pingback: 5 Google Analytics posts you don’t want to miss in December - Google Analytics NotesGoogle Analytics Notes
Pingback: Digital Debrief – Testing with a Rapid Optimization Plan
Pingback: Testing with a Rapid Optimization Plan