The Pages report is a fantastic way of gaining a better understanding of your website’s performance. It allows you to monitor and track how popular each page and screen is with your users.
Page reporting is one of the most important aspects of Google Analytics data analysis and should be one of your favorite features. We’ll fill you in on what pages reporting is, how it’s beneficial to you, and what it looks like in GA4.
What Is the Pages Report?
Looking at the Pages report is a fairly common way to analyze your data. Basically, it shows you a breakdown of how your website and mobile app pages or screens are doing.
Pages reporting in Google Analytics 4 specifically measures the performance of a web page or screen based on the number of views it gets. You can also observe other metrics and dimensions for each page.
You even have the ability to add secondary dimensions and customize the metrics and segments you apply against the pages report, making this report even more useful.
How It Helps You
Page reports are super beneficial to help you keep up to date with what is happening on each page of your site or app. This information allows you to make better decisions with regards to marketing, design, content, and optimization.
You will be able to see what your users find most interesting and which pages draw them to your site. You can use this information to optimize your site and tailor future content so that it’s suited to your audience.
The Pages report can also help you understand underperforming pages on your site so that you can focus your efforts on improving the page functionality or content focus.
What’s New in GA4?
In GA4 the pages report has had a little makeover and is slightly different than what it was in Universal Analytics.
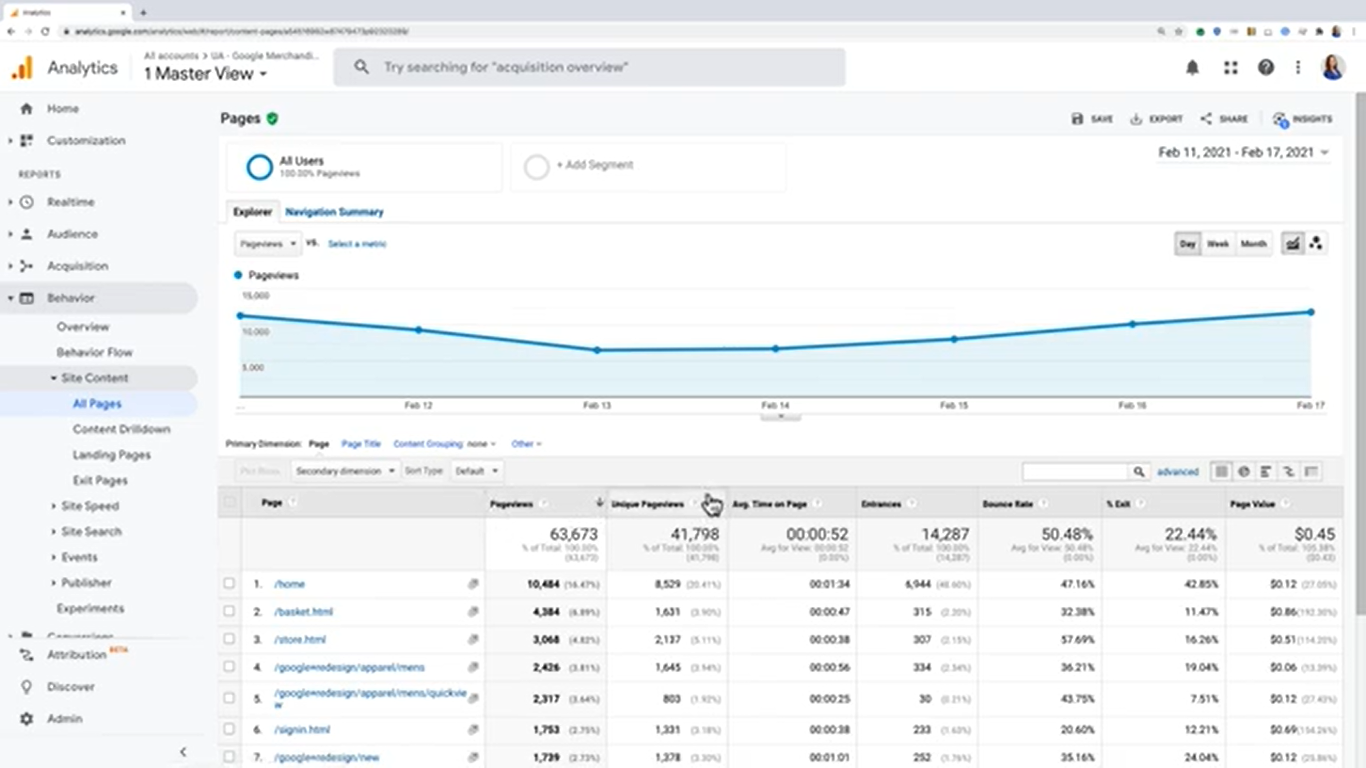
In Universal Analytics, you had to navigate to ‘Behavior’ then ‘Site Content’ and ‘All Pages’ to view the pages reporting. You could examine metrics such as ‘pageviews’, ‘unique pageviews’, avg time on site, and a few others too.
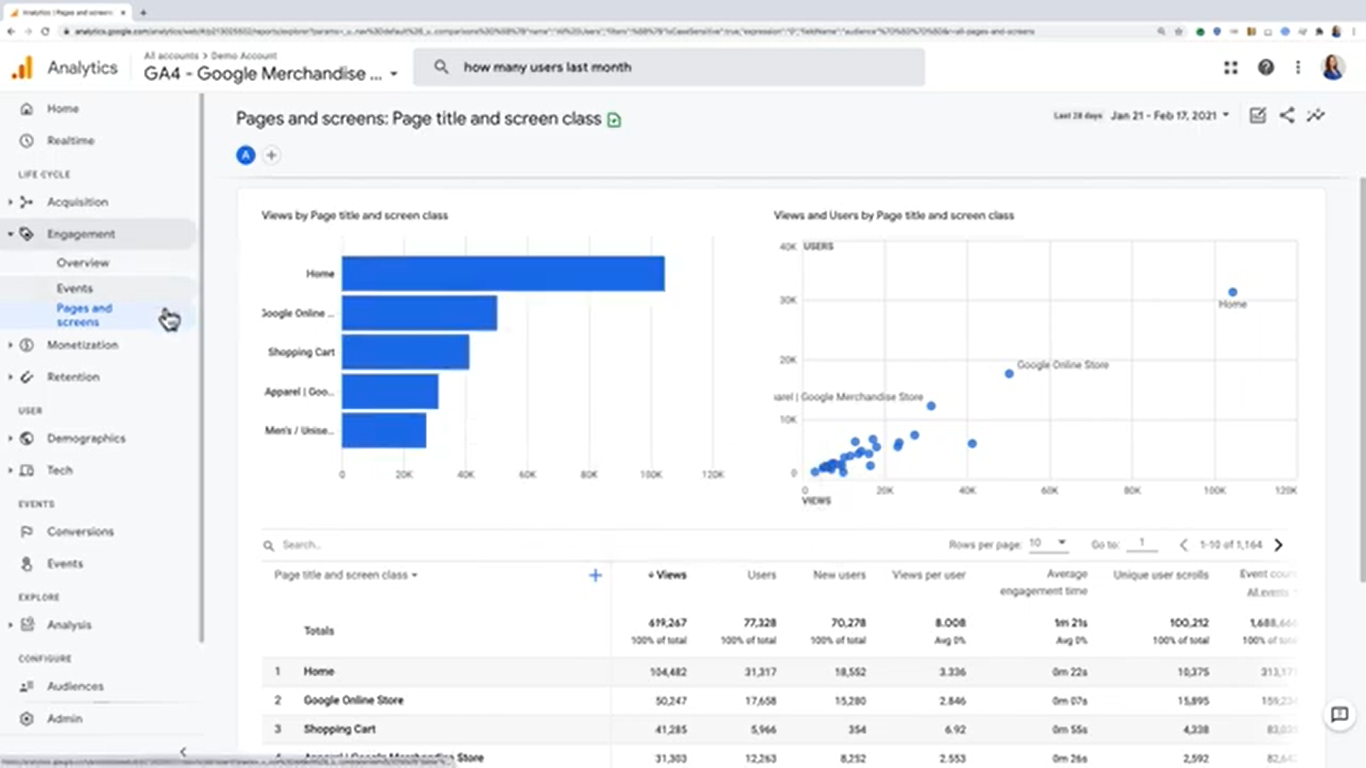
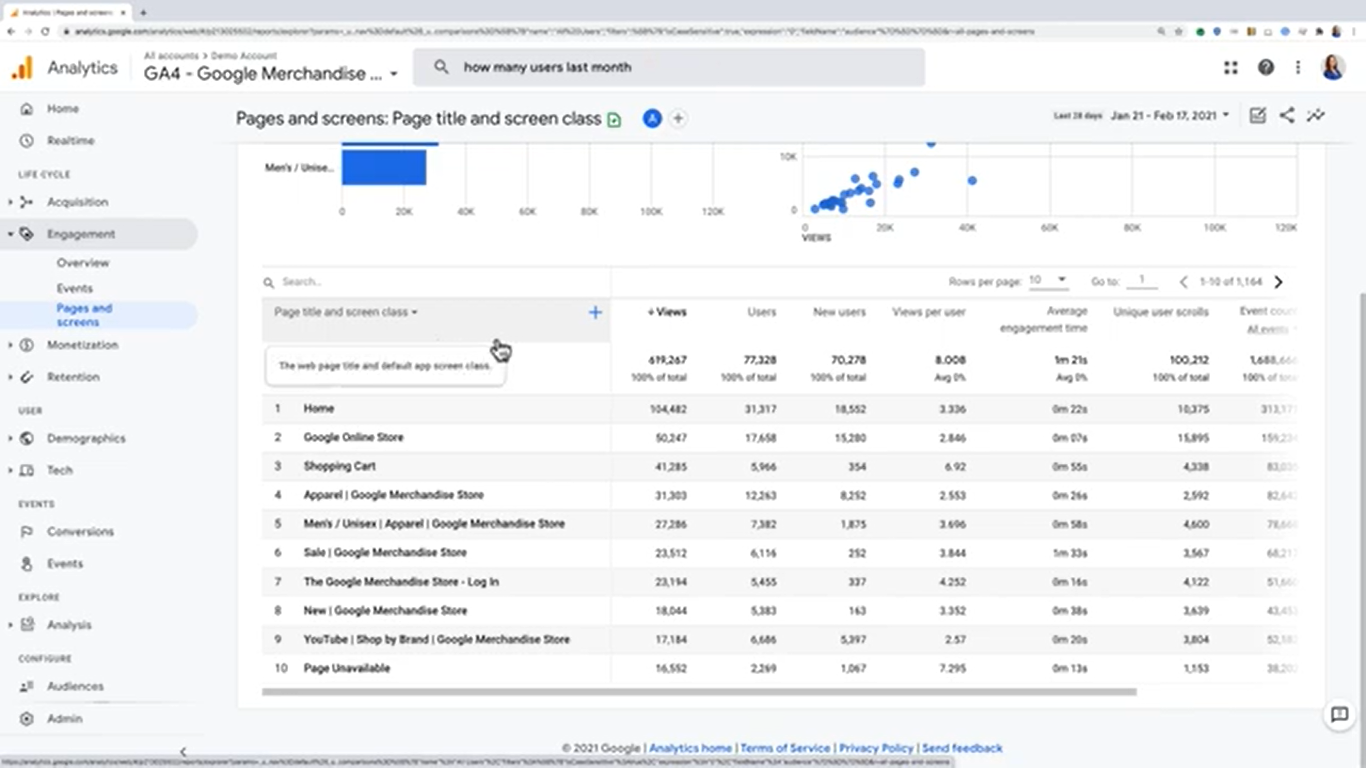
In Google Analytics 4, the web stream and app stream data will be collected under the ‘Pages and screens’ report which lives in the ‘Engagement’ section in the left hand nav. In addition to a new report location, you’ll also notice some new metrics.
Let’s go through a quick step-by-step guide to accessing the pages reporting on GA4:
1. First, click on ‘Engagement’.
2. Navigate to ‘Pages and screens’.
3. You will be taken to a page with a table report and two graphs.
4. Take a little scroll through the page to discover all of the data available.
The primary dimension will be ‘Page title and screen class’, which is followed by plenty of other metrics, such as; ‘Views’, ‘Users’, ‘New users’, ‘Views per user, and ‘Average engagement time’.
The most effective way to get used to this new layout is by exploring all of the features, dimensions, and metrics. You’ll be able to have some fun while getting familiar with how you will report on pages and screens in Google Analytics 4.
If you’re more of a visual person and want to see me navigate through pages reporting on GA4 then take a quick look at my YouTube clip below.
GA4 has so many incredible features that will enhance the way you do business and run your website. It can be overwhelming sometimes which is why I have compiled insightful courses on Google Analytics 4. You can check them out at https://ksdigital.co/academy/ .
1 thought on “Pages Reporting in Google Analytics 4”