In this post I’m excited to highlight new templates, covering Use Cases and Industries, as well as a couple of newer techniques now available in App+Web Analysis.
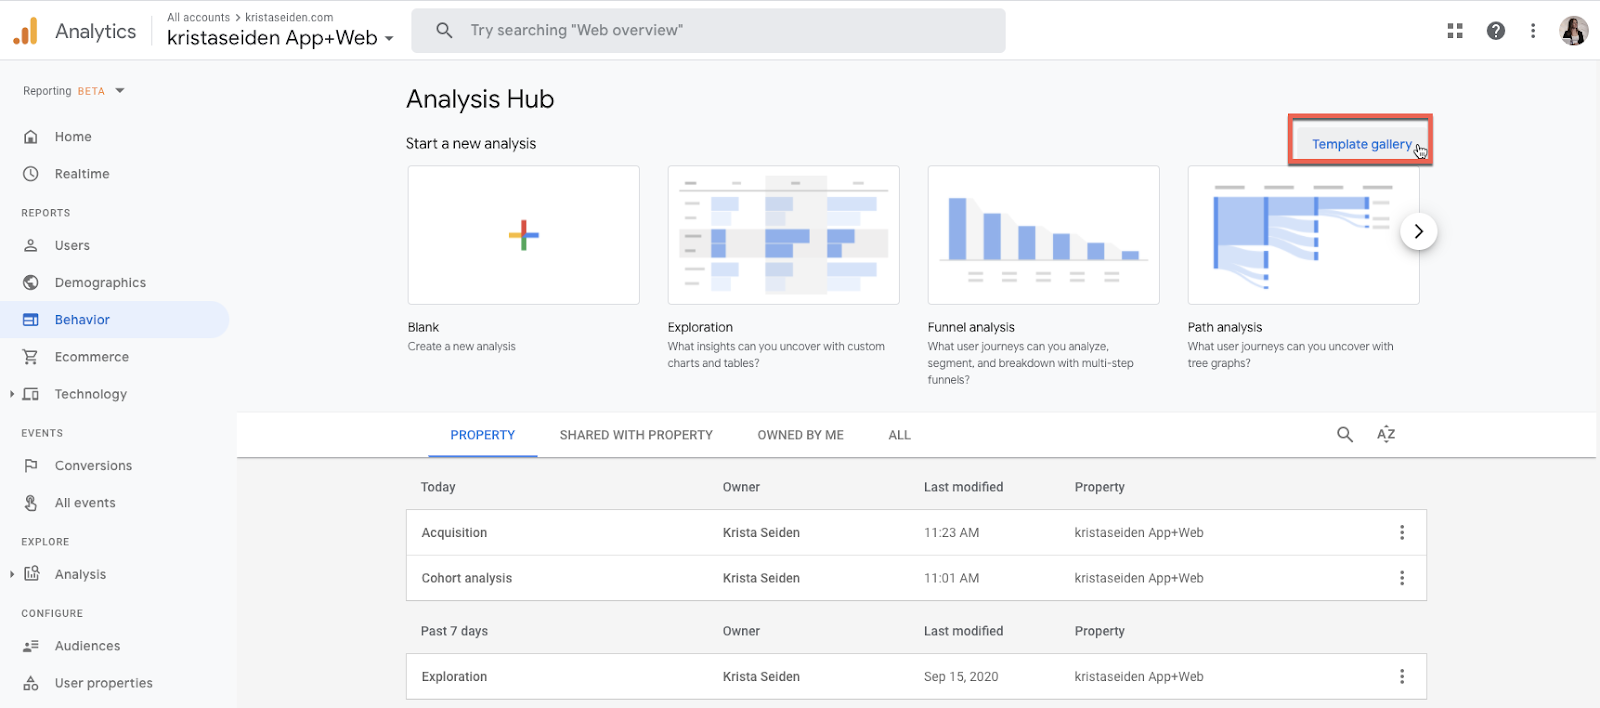
To find these new templates, navigate to the Analysis Hub, and in the upper right hand corner, click on “Template gallery” to show all of the options now available.
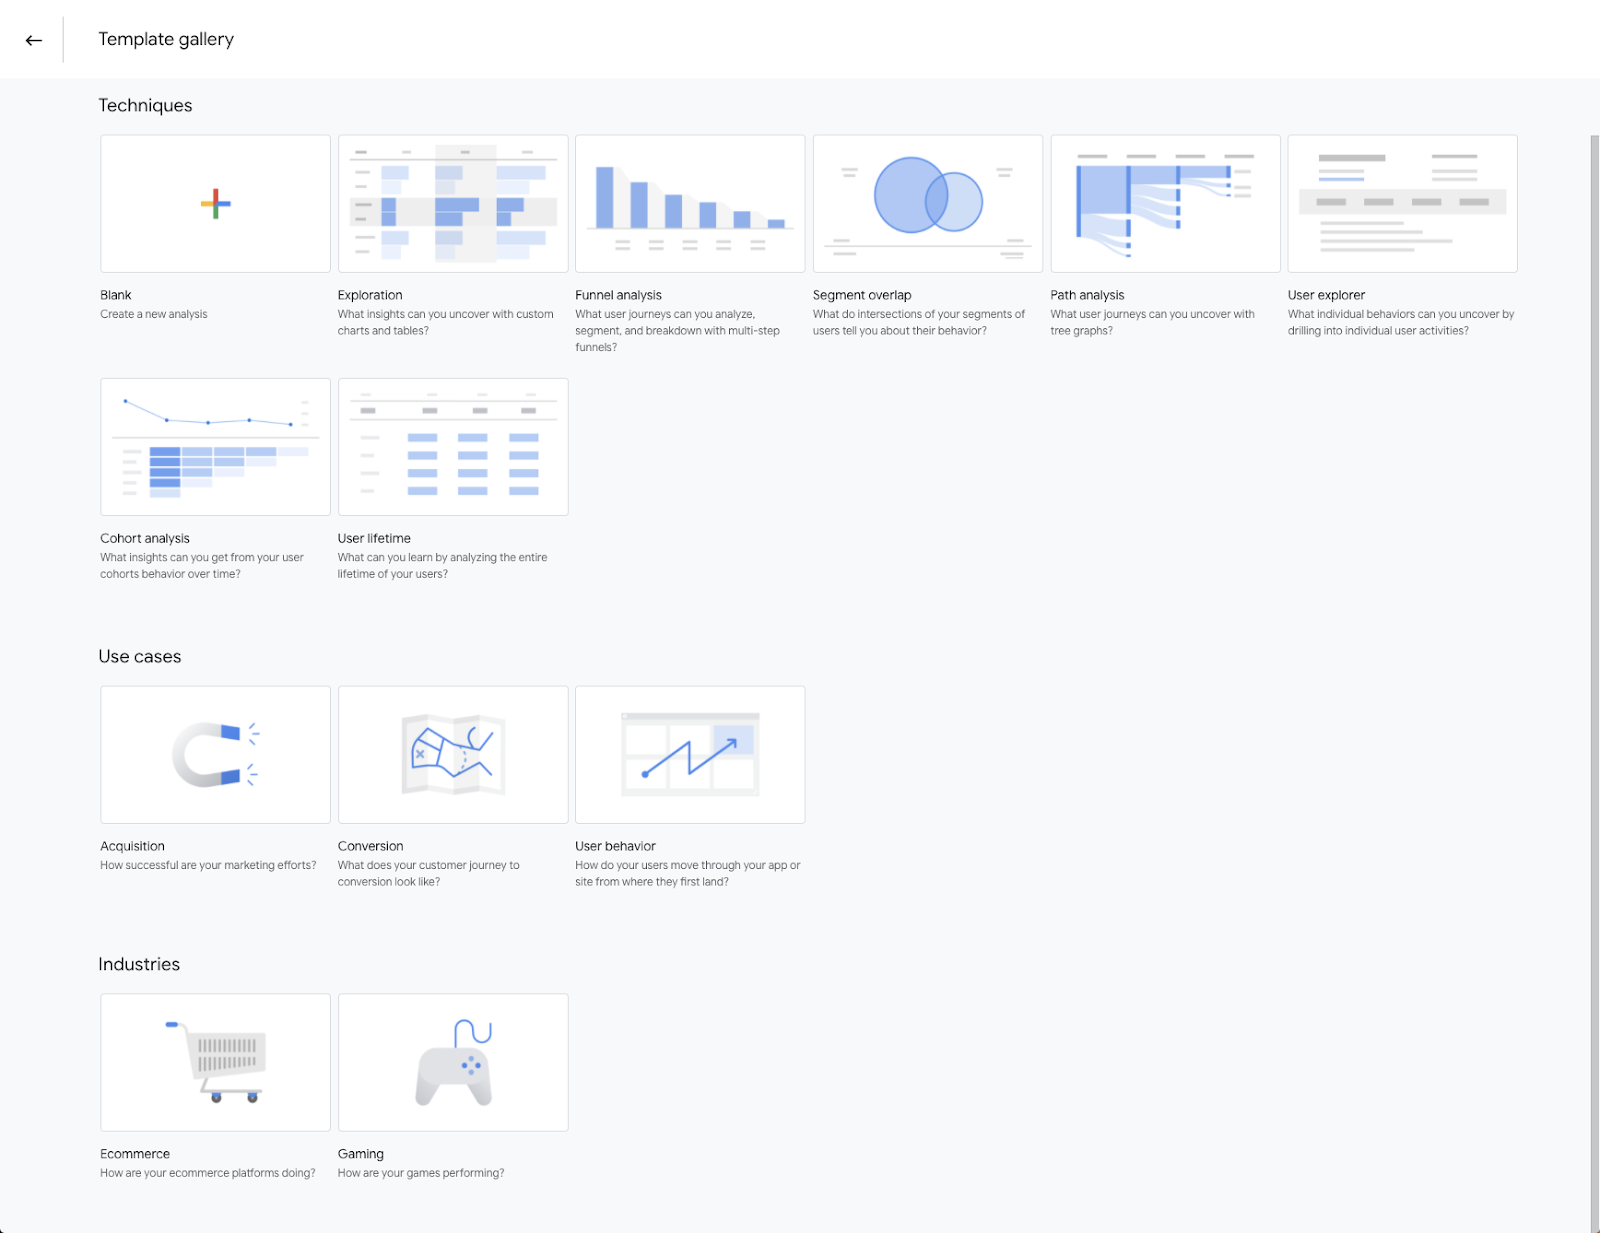
Once you open up the Template Gallery, you’ll see the new options. This includes an expanded list of techniques, as well as two new sections which are pre-populated templates covering some of the major use cases of Google Analytics (Acquisition, Behavior, and Conversions, aka the ABC’s of Analytics!), as well as the first (of what I hope will be many!) industry specific templates. It’s a great way to get started with some pre-built reporting in Analysis while still allowing you to customize and take full advantage of the advanced features of Analysis.
Use Cases
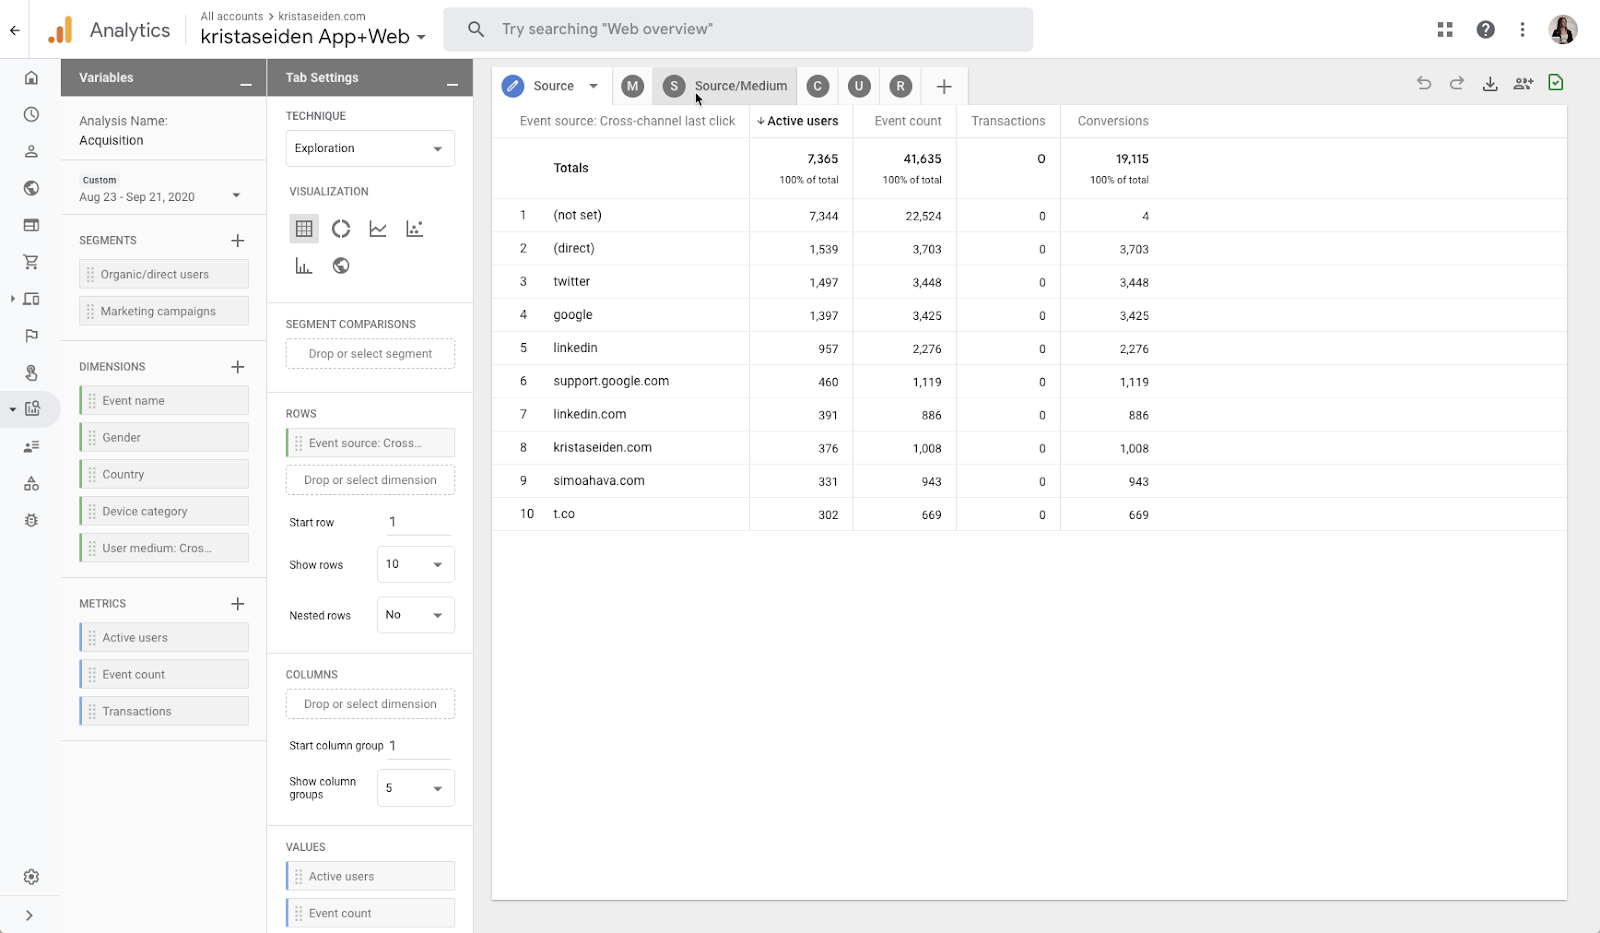
Acquisition: This template pre-populates 6 different tabs of reports related to acquisition. In the first screenshot, you’ll see the report for Acquisition by Source. The next tabs show acquisition by Medium, by Source/Medium, and by Campaign.
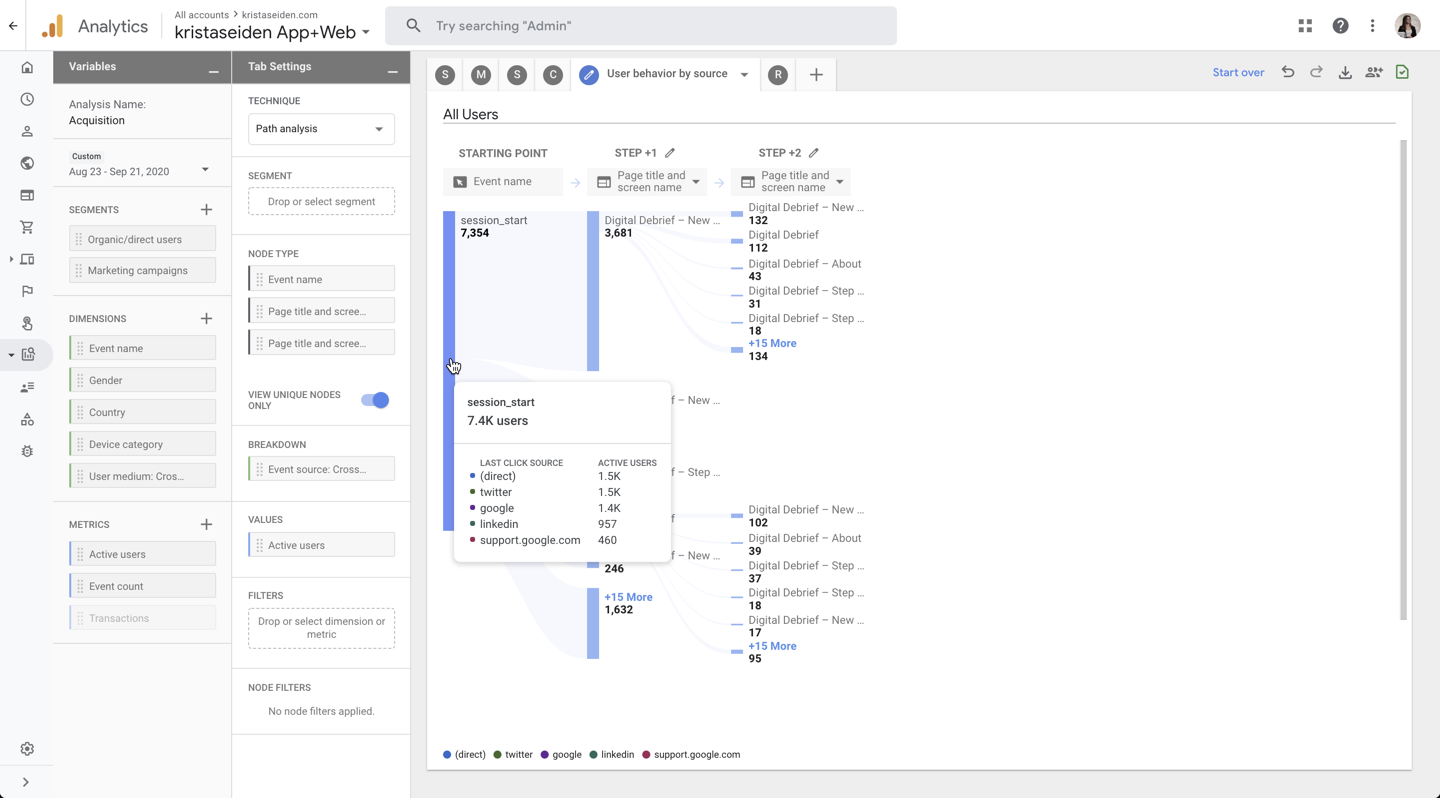
Next the Acquisition section switches techniques and uses the Pathing technique to display user behavior by Source, meaning Source has been applied as a breakdown, meaning if you hover over any of the end nodes, it will show a popup box over each node highlighting the Source of acquisition for users at that node. Pretty cool!
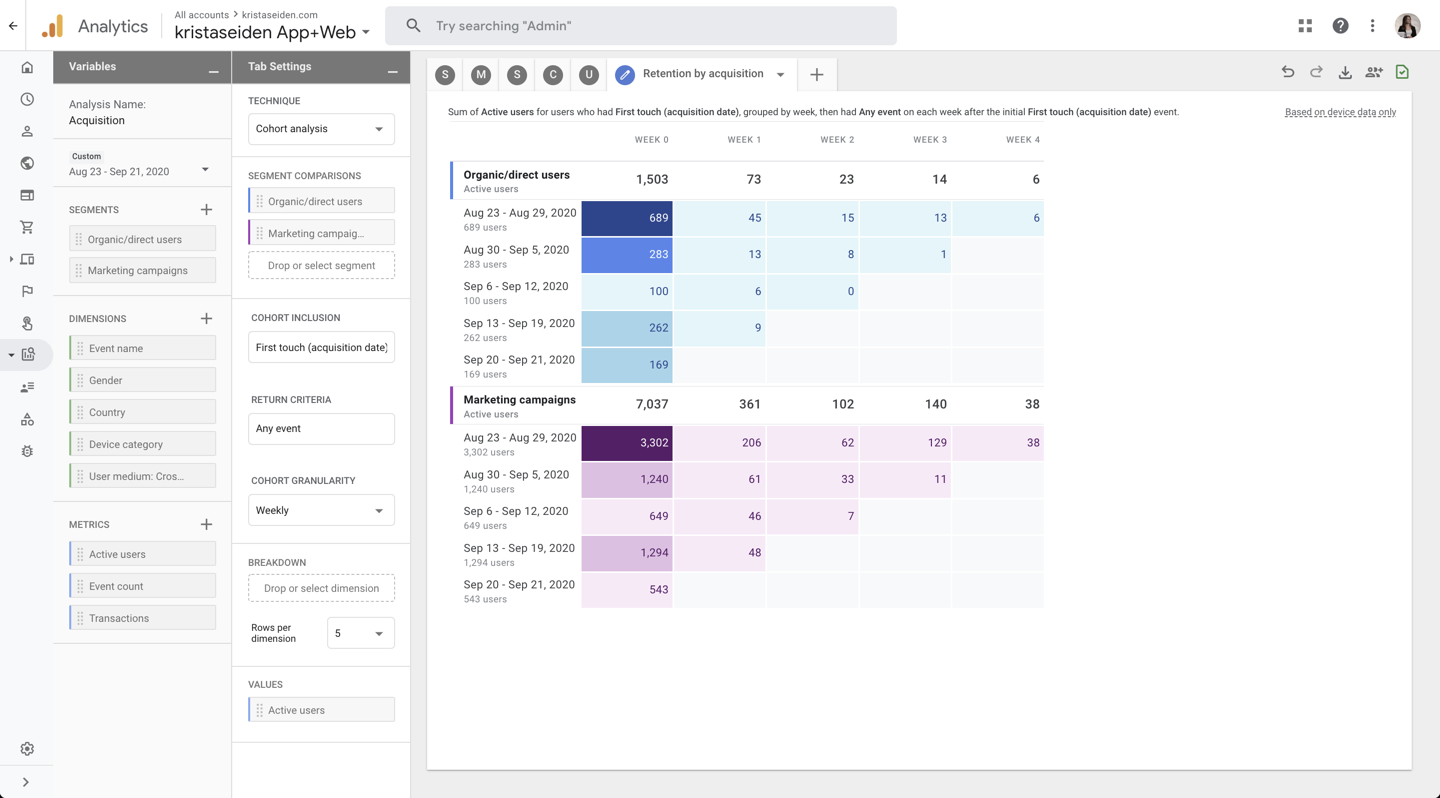
The last tab under the Acquisition section uses the Cohort reporting technique to show Retention by cohort. What’s neat about this pre-populated template is that it also applies 2 new segments: Organic/Direct, and Marketing Campaign (not direct or ‘not set’) to compare their retention periods.
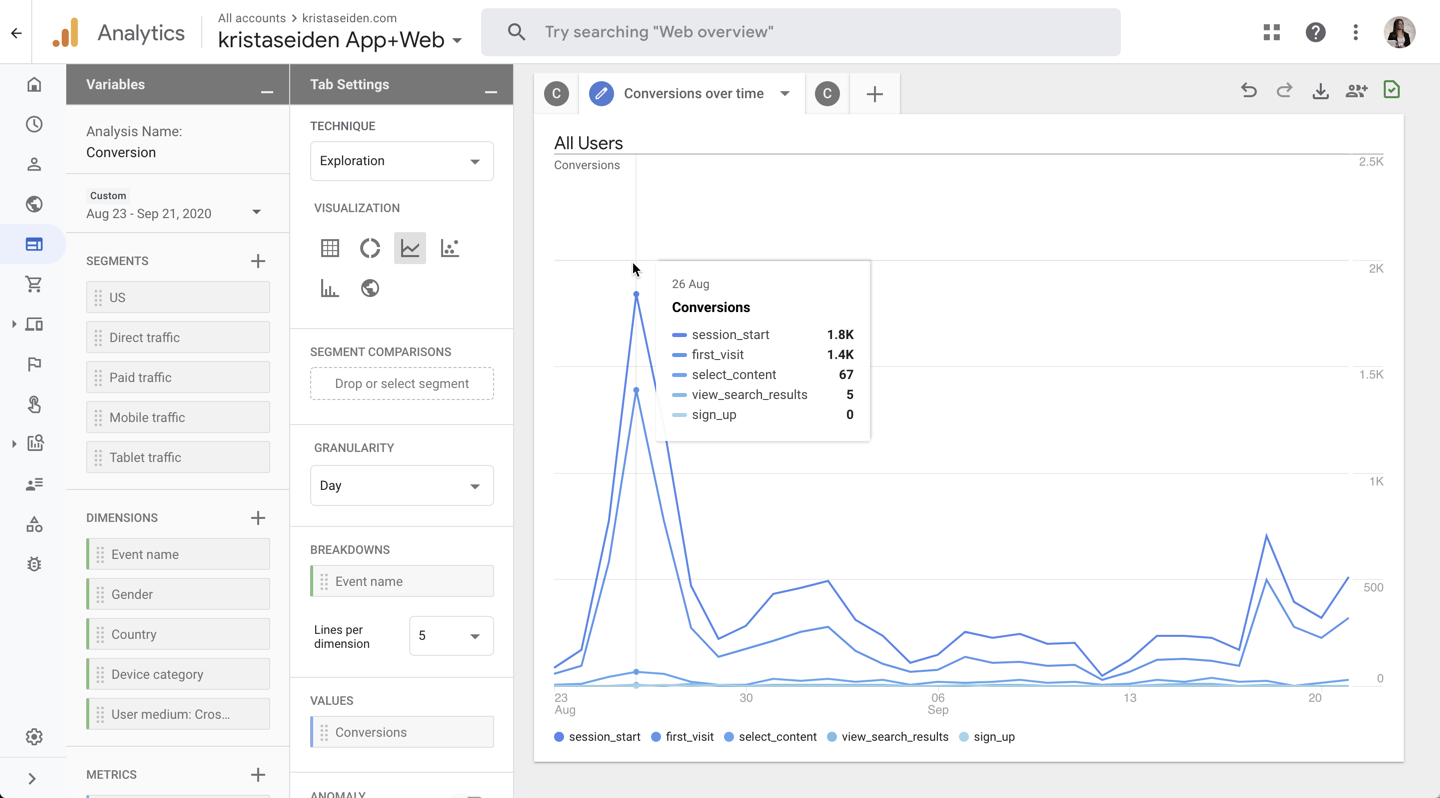
Conversions: This template looks at how your site or app is converting, based on the events you’ve deemed as ‘Conversion events’ in setup. The first tab is an exploration report looking at a count of event conversions for each of your specified Conversion Events. The second tab will trend your conversions over time. If you hover over a point on the trendline, it will show a popup highlighting the details for each Conversion Event.
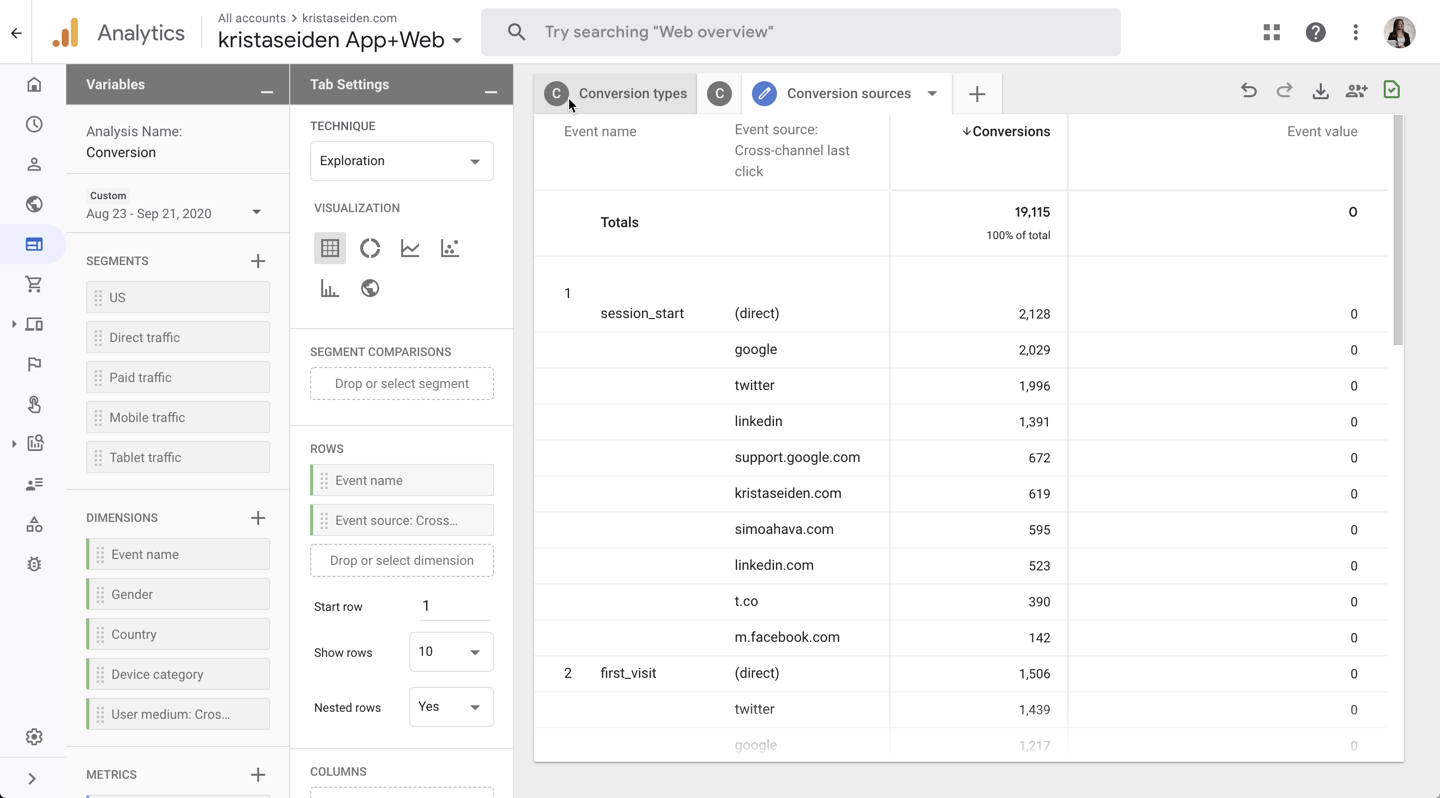
The last tab in this template shows your Conversion Sources. Basically, it breaks down your Conversion event in the first column by an addition dimension in the second column looking at Source.
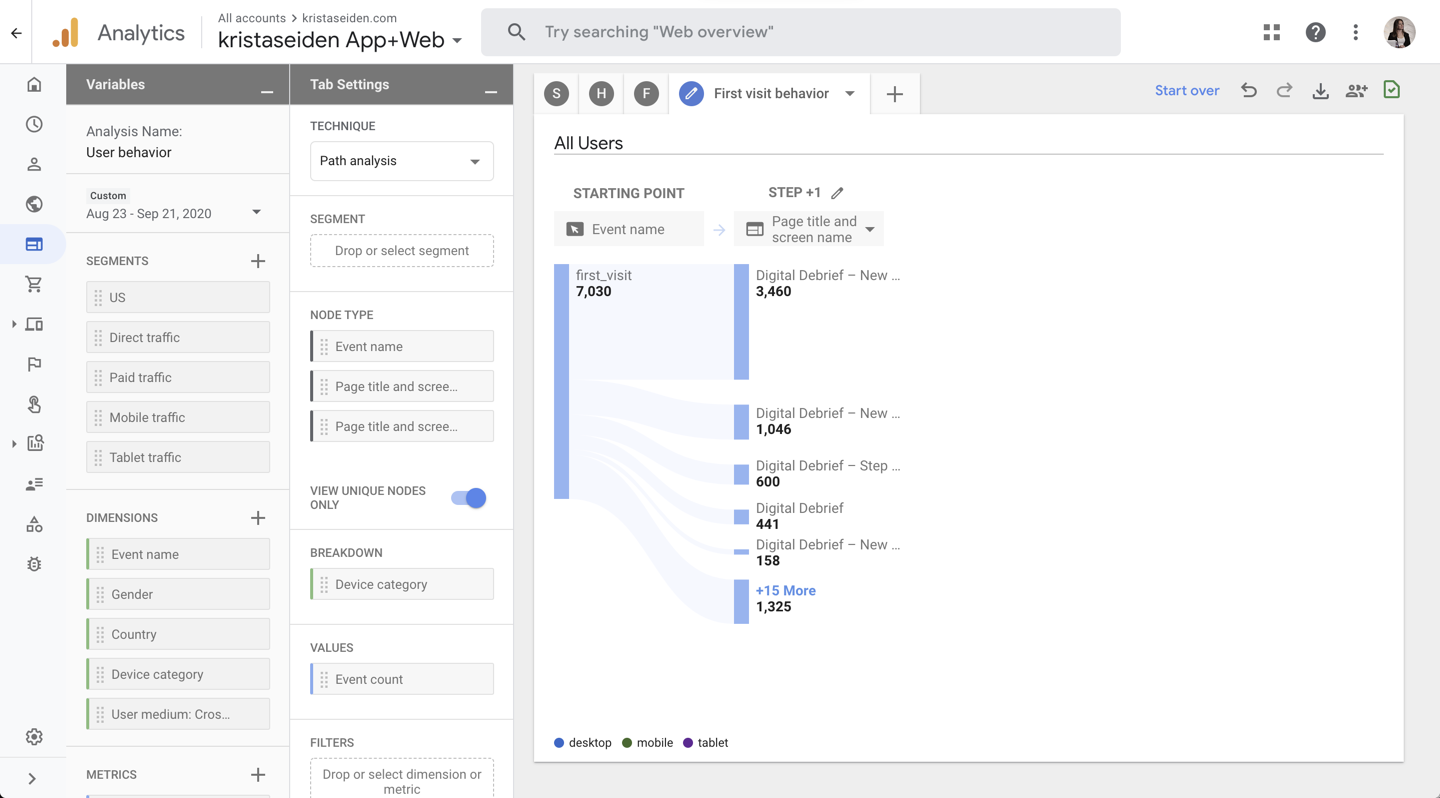
User Behavior: User Behavior reporting includes 4 pre-populated reports (2 of which are app specific, so if you don’t have an app, they will be blank) using pathing as the technique to explore user behavior, either by session start behavior or first visit behavior.
Industries
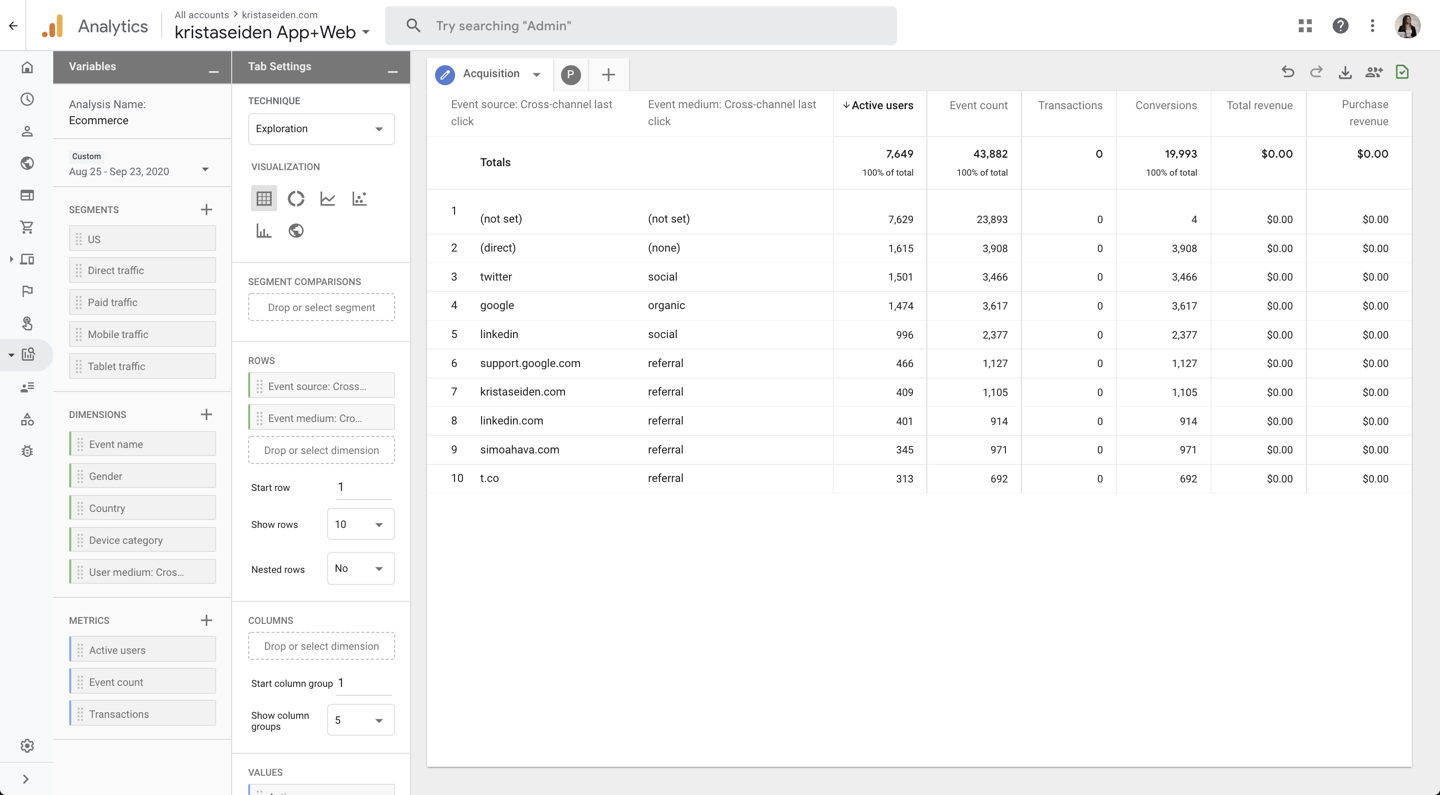
Ecommerce: This pre-populated industry template includes two tabs. The first tab is Acquisition (Source/Medium) by Ecommerce specific metrics such as transactions, conversions, and revenue. In my example property, I do not have Ecommerce setup, so the results here are a bit underwhelming, but you can at least get the idea. The second tab shows Path to Purchase, but again, this uses Ecommerce events, so there is no data in mine.
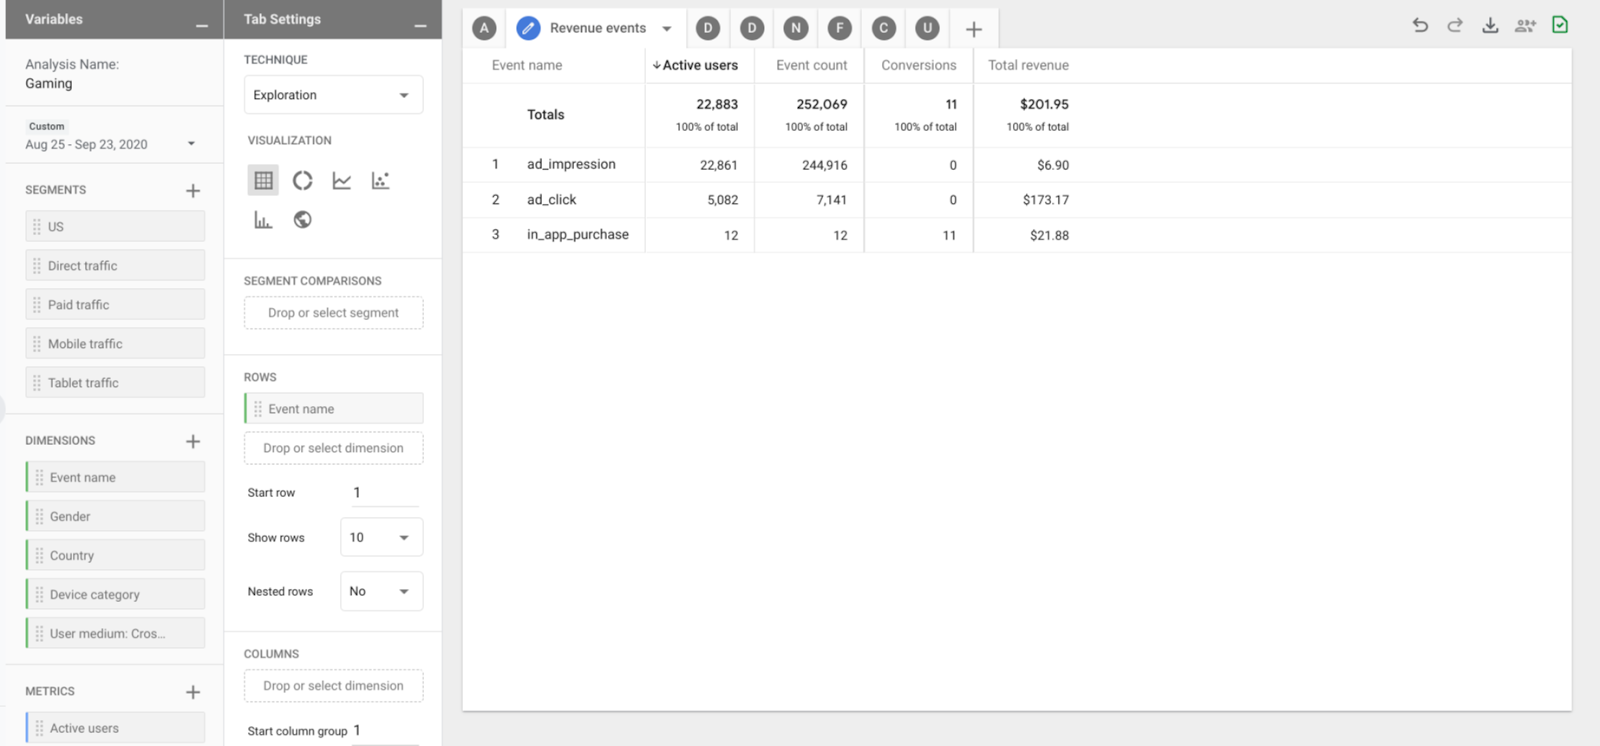
Gaming: In my opinion, the team got it right with this pre-populated template. It’s got a bit of everything and really shows the power of Analysis, utilizing multiple techniques and applying them to a single analysis objective. The first tab is the simplest, Acquisition by Source/Medium. The next tab shows Revenue Events, which are events such as ad_impression, ad_click, and in_app_purchase. It then shows metrics of event count, users, conversions, and revenue associate with each of these events.
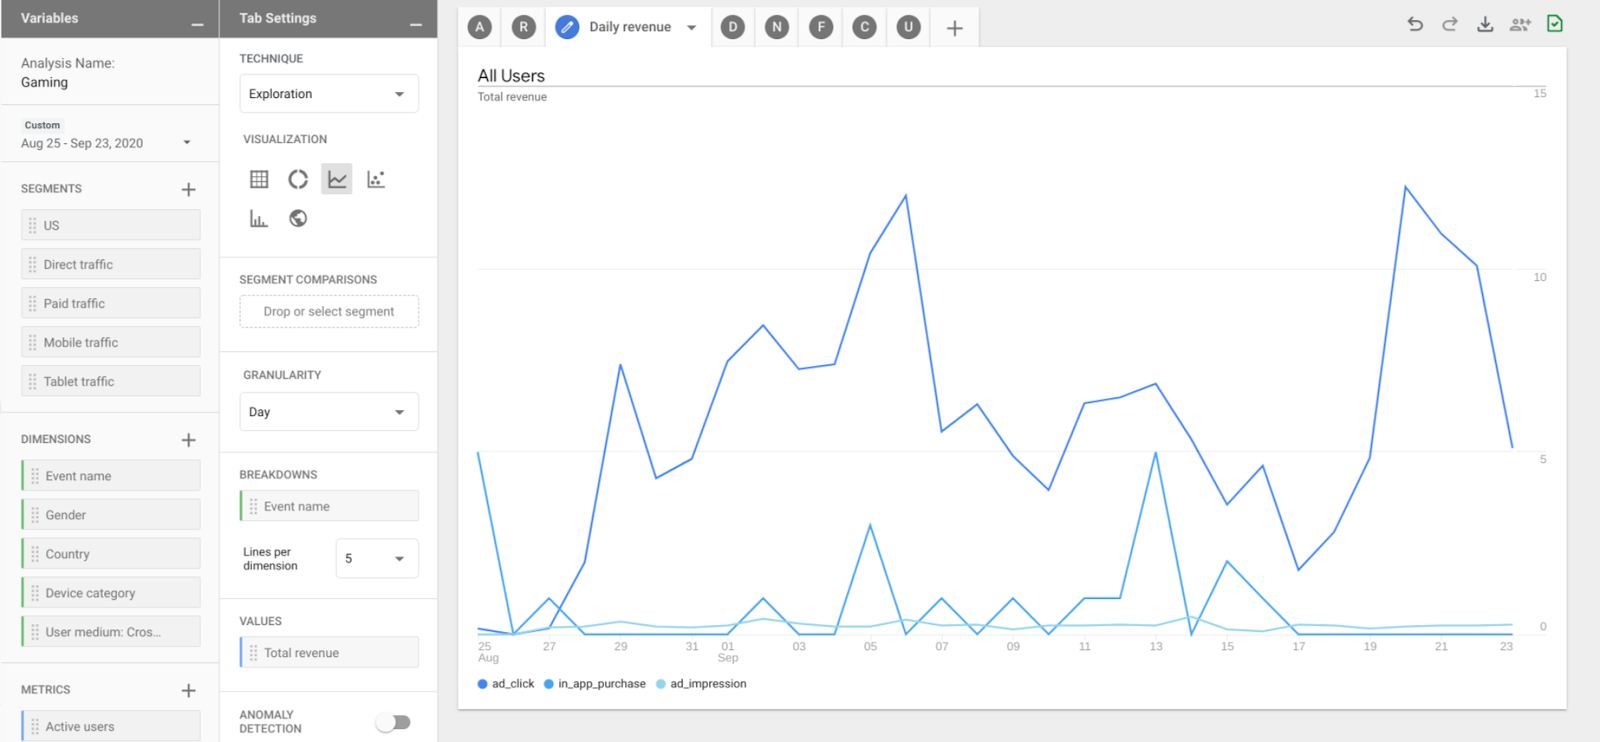
The next tab shows daily revenue trended over time for each Revenue Event.
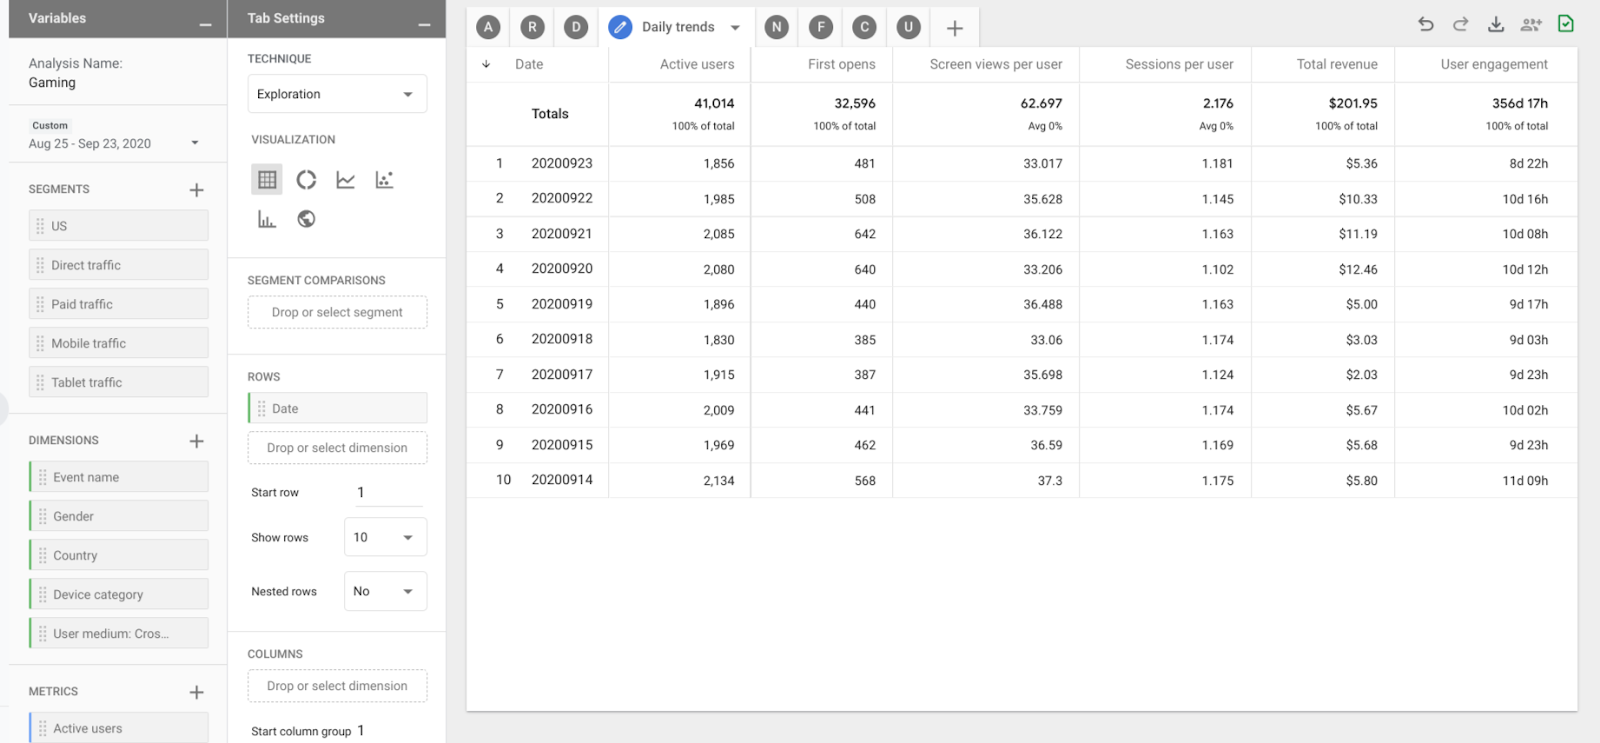
Next we get Daily trends which shows a breakdown by date of things like users, first opens, screen views/user, and revenue, amongst other metrics.
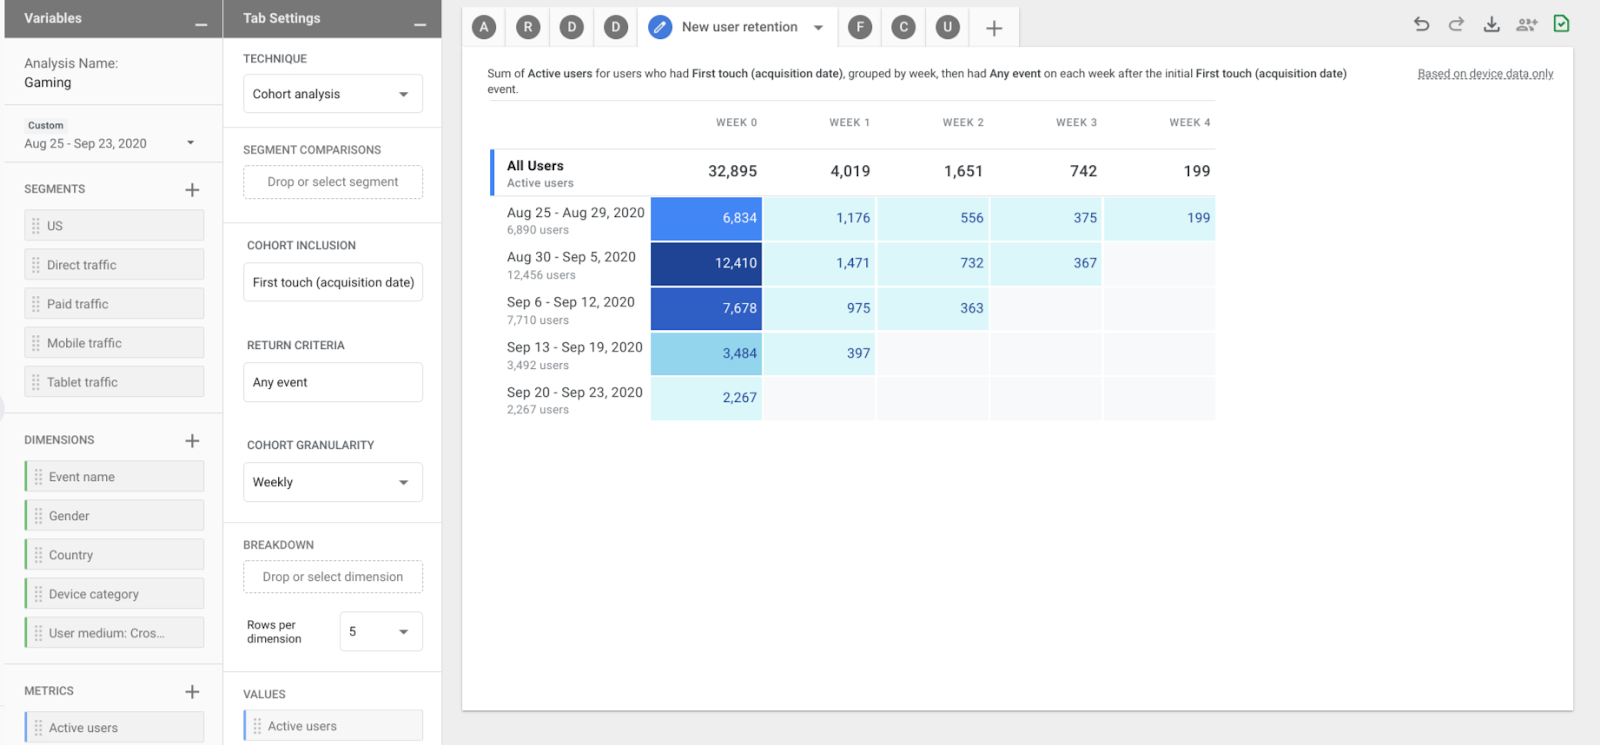
The fifth tab shows a Cohort report looking at New user retention.
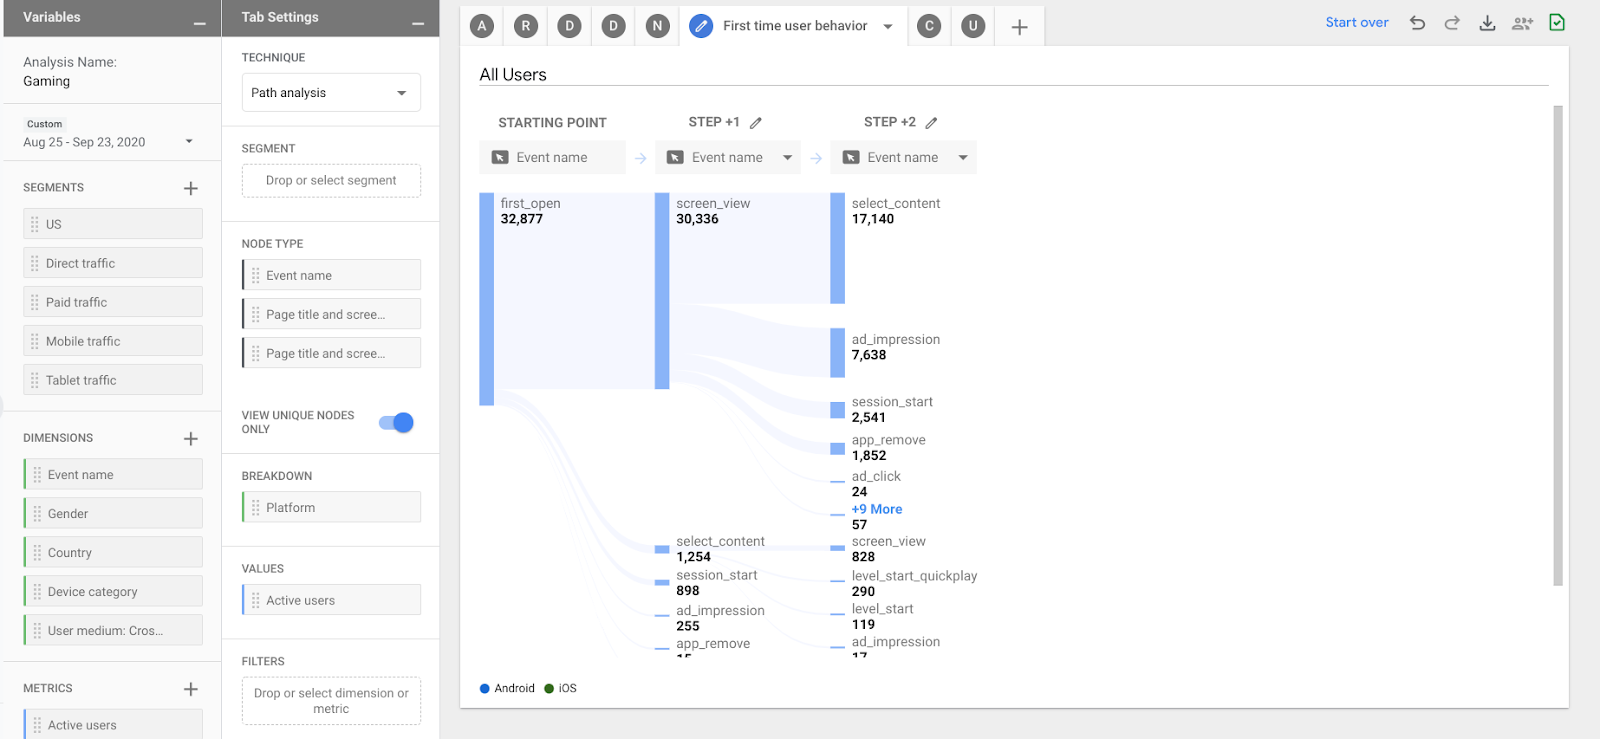
The sixth card uses the Pathing technique to look specifically at First time user behavior, from first open through their various paths taken.
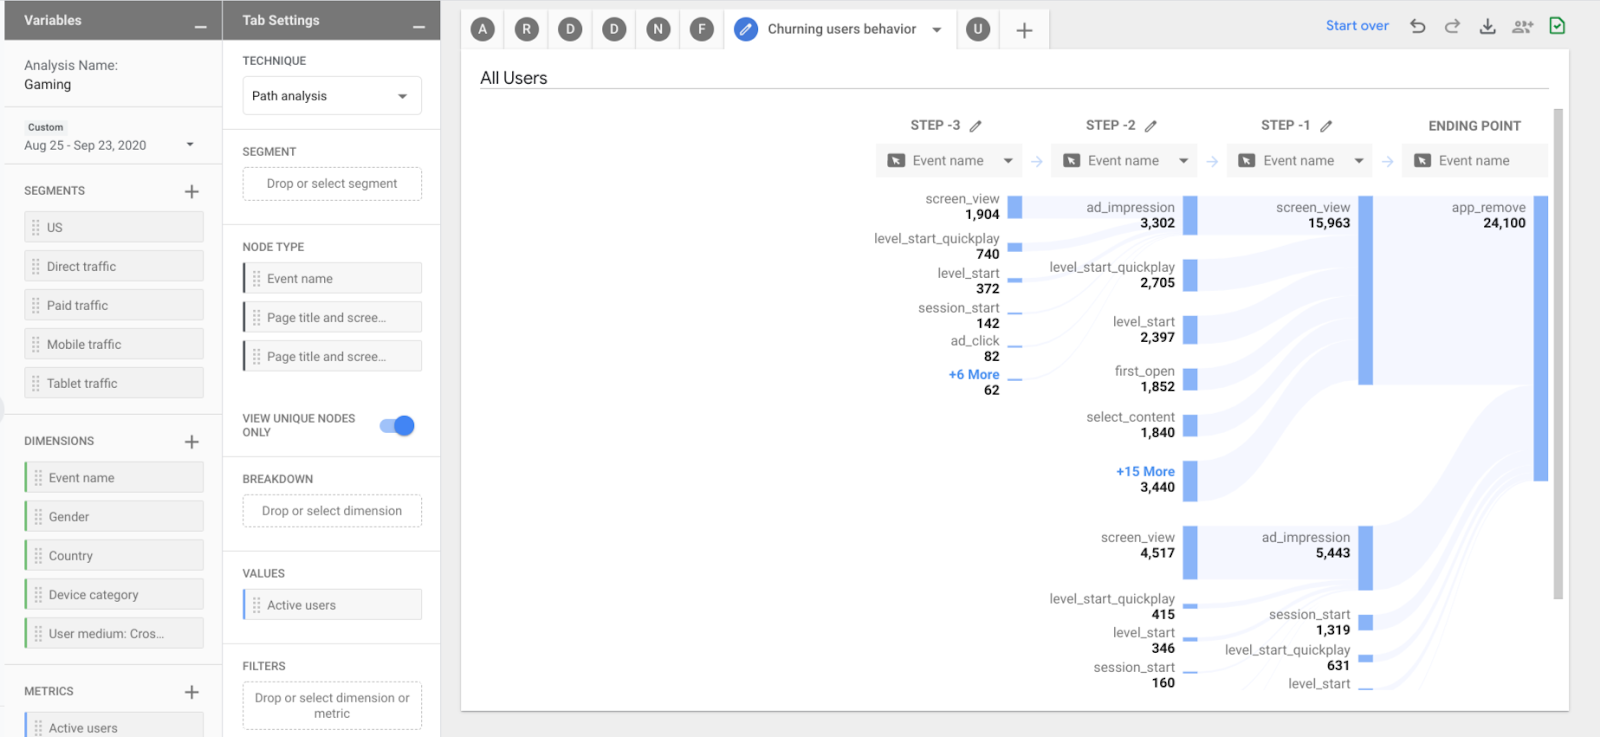
The second to last tab utilizes Backwards Pathing to look at Churning User behavior. I love this application of Backwards pathing and this is a great example of how it can also be used elsewhere. In this case, I see a couple of occasions where an ad_impression led either directly or indirectly to a churn, and so I might use that info to try to optimize the placement of my Ad impressions to try to reduce churn.
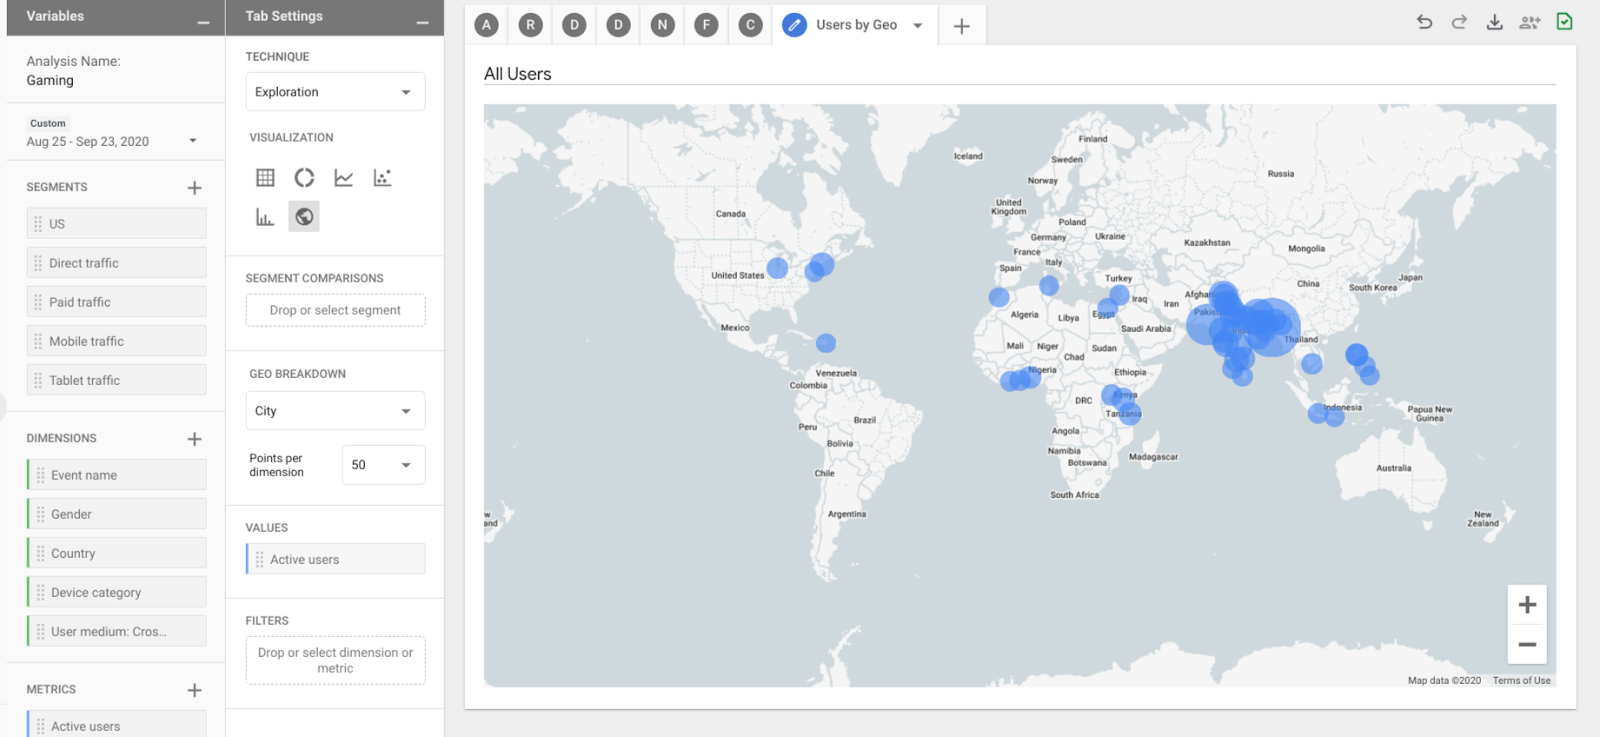
The last tab (the eighth pre-populated report in this template!) shows a geo breakdown (a feature of the Exploration technique) of where active users are located.
Techniques
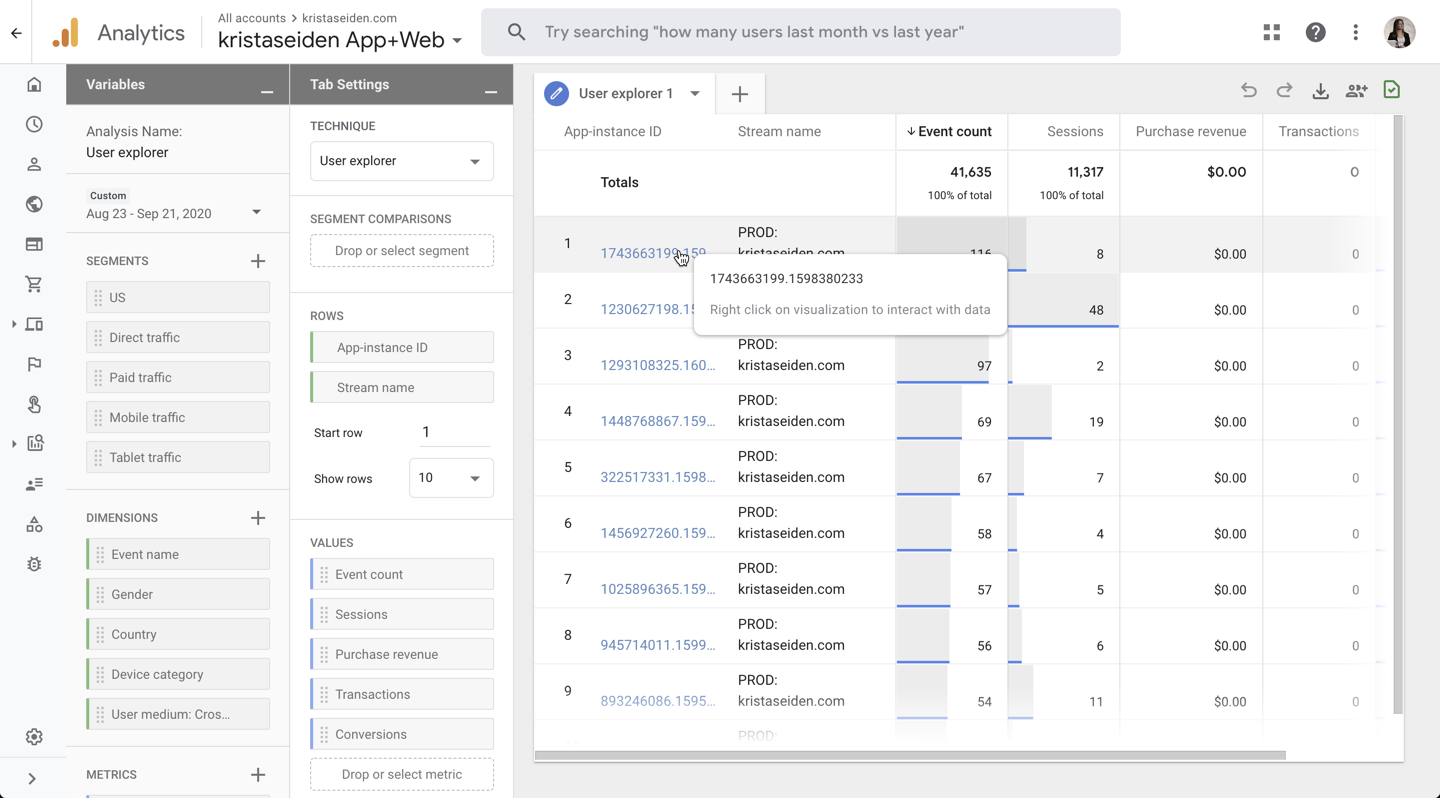
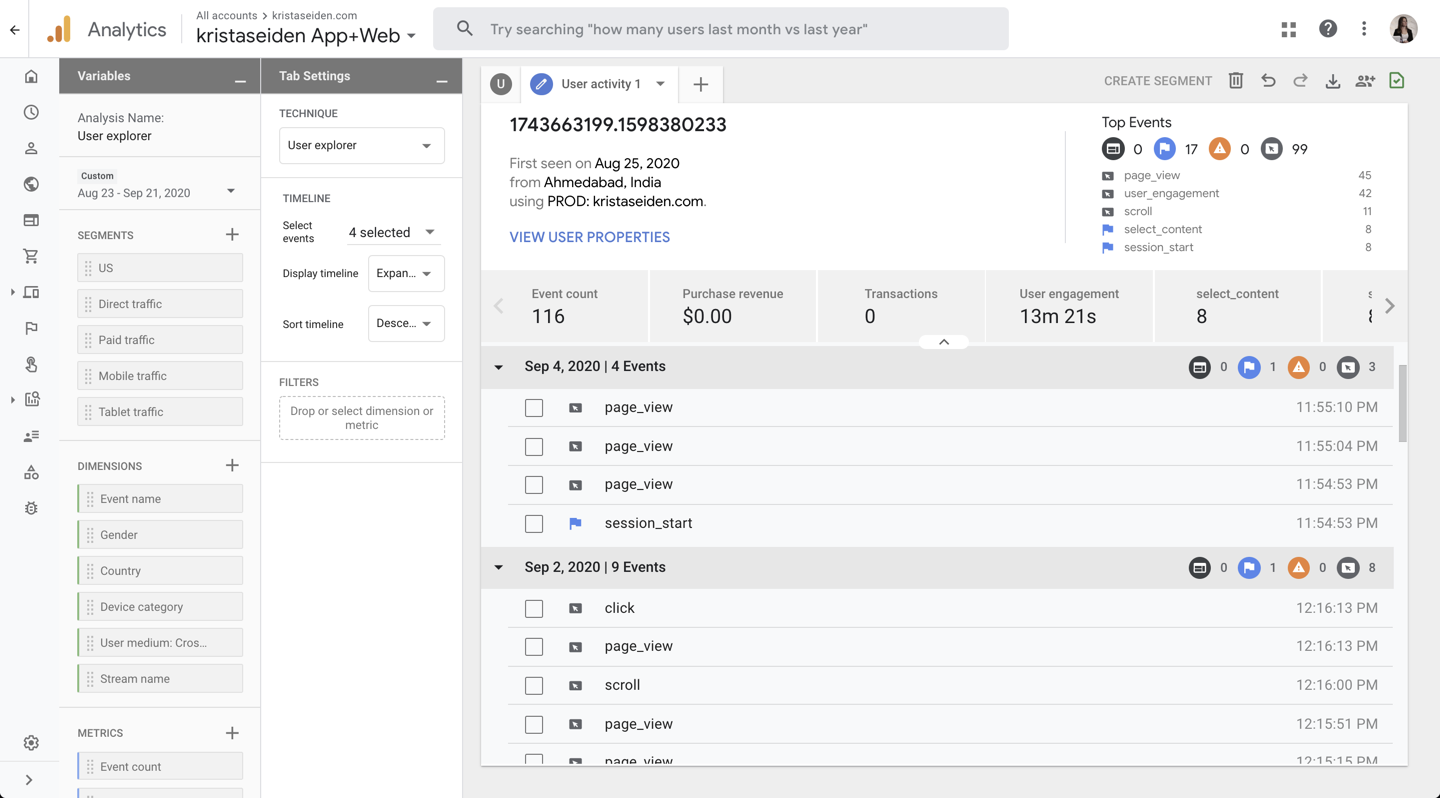
User explorer: this one has existed for a while, but since I’m walking you through several new analysis techniques and I haven’t previously covered this one, I’ll cover it here. User explorer analysis previously existed in Universal Analytics, as well as in debugview, but now here in Analysis it offers additional functionality (segmentation, selection of values, filters, etc) which can make it even more useful.
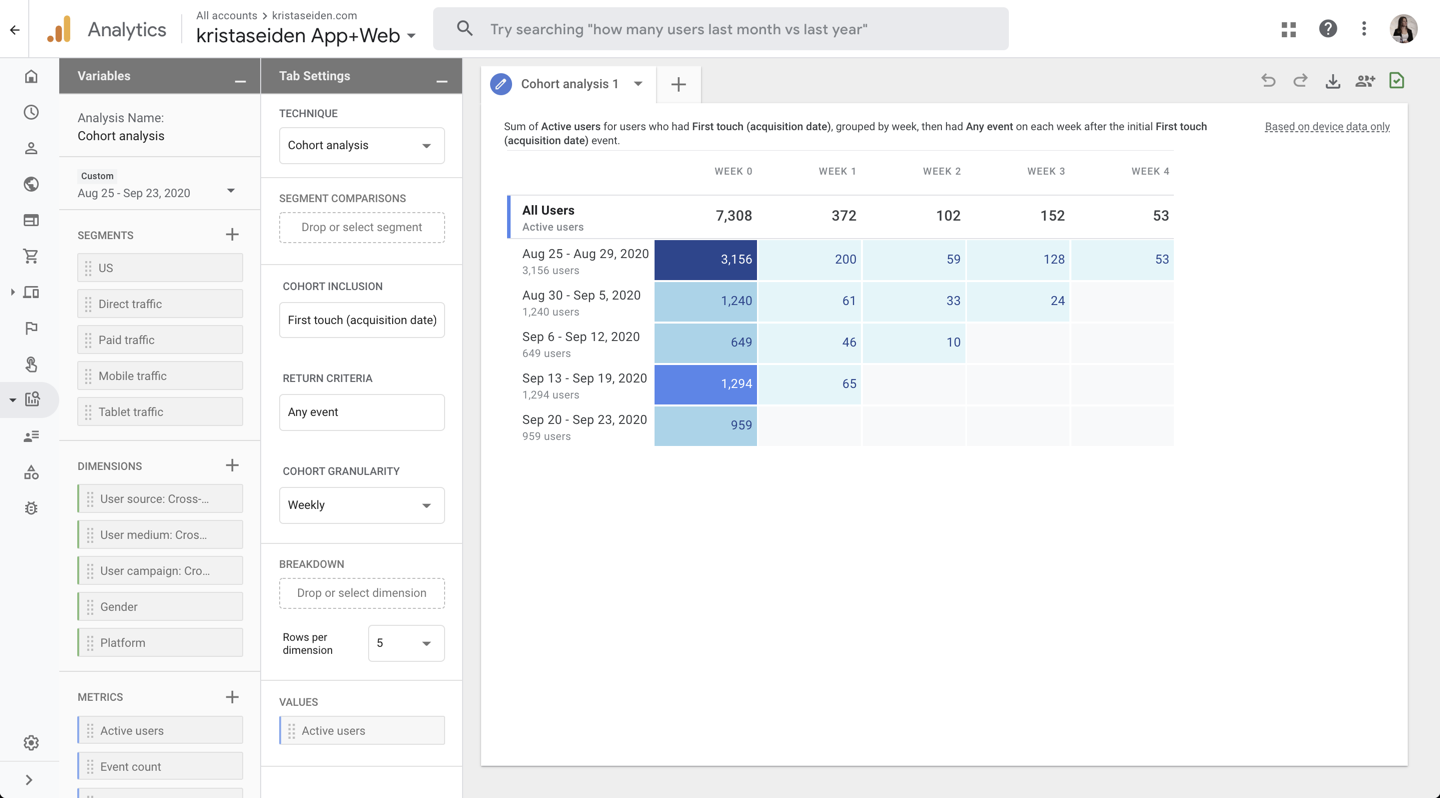
Cohort Analysis: This one has also been around for a few months, but again, since I haven’t previously covered it I’ll highlight it here. With Cohort Analysis, you can track a cohort of users by “cohort inclusion” criteria, in tis case, acquisition date, and track them over time. Cohort analysis previously existed in Universal Analytics, however, with Analysis, it becomes much more useful since you can segment/compare segments, break it down, and more.
If you’ve read this far, you can see how much was in this latest release, and how useful these new templates (Use Cases and Industries) are. Even if you don’t sit in the industries shown here, you can still use the templates as jumping off points. How else have you been able to put these new templates to use?