Using Site Search data in GA4
If you’re used to analyzing site search data (on site search) in UA, you can do this in GA4 too!
In fact, GA4 actually measures site search out of the box for you via enhanced measurement.
Follow along below to learn 3 ways to access this data.
To take advantage of this data though, there is one small setup step you need to take to see search terms in reporting: register the automatic “search_term” parameter as a custom dimension. Once you do that, you’ll unlock all of the site search data you’ve been craving!
To register any parameter as a custom dimension, follow these quick steps:
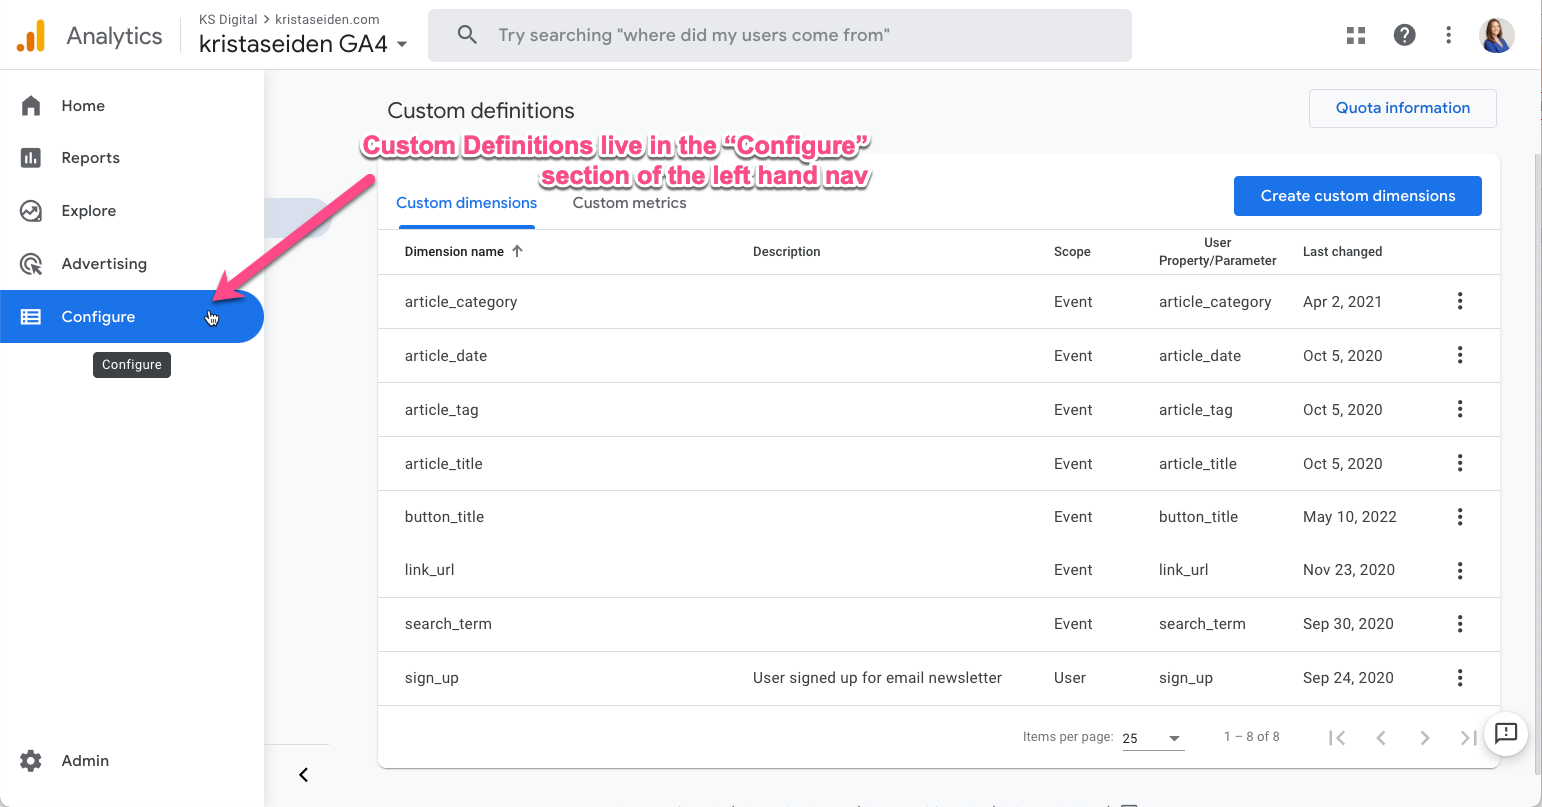
- Go to the Configure section
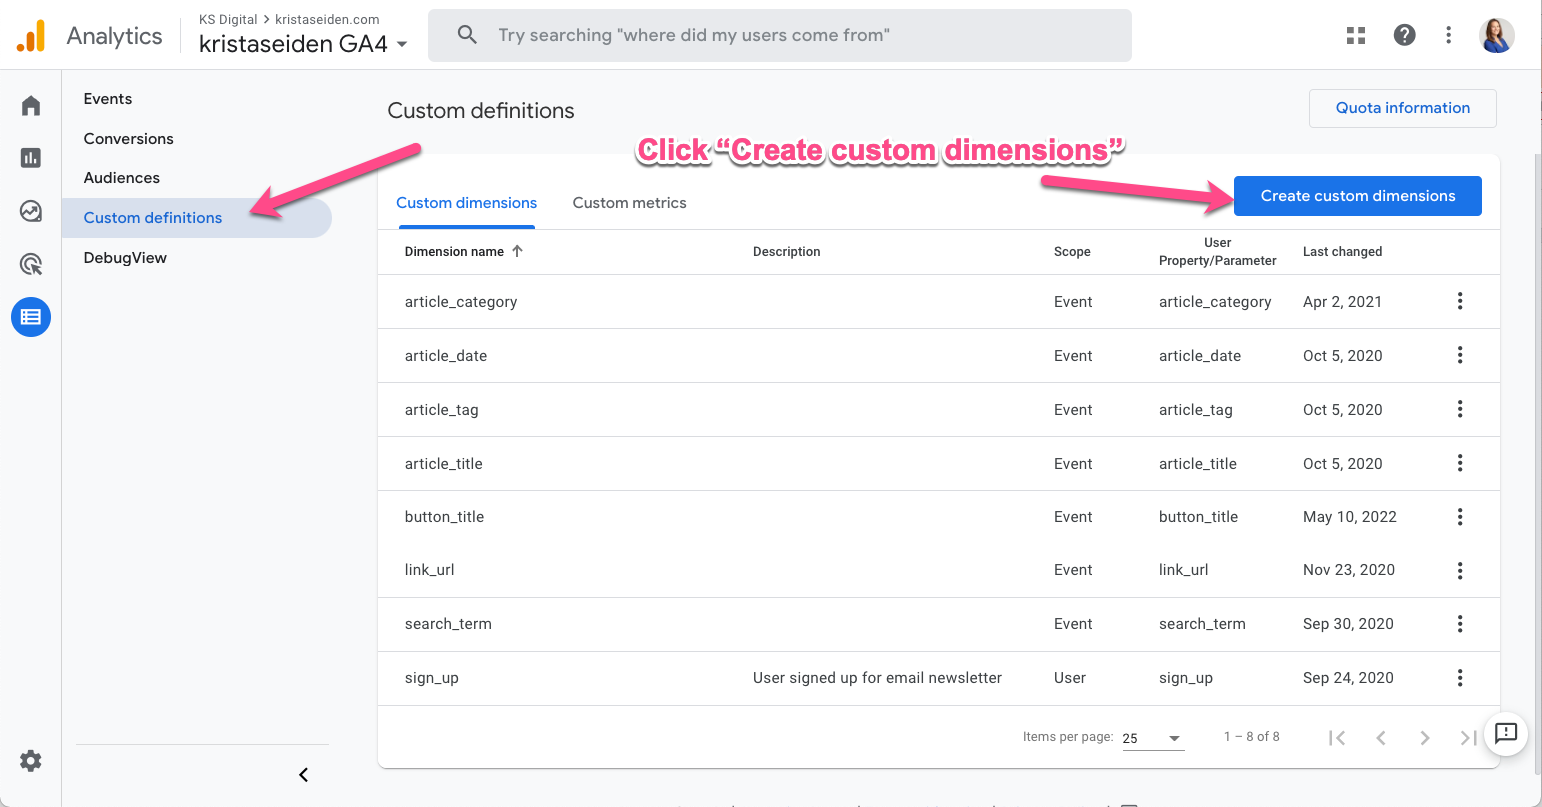
- Click “Create custom dimensions”
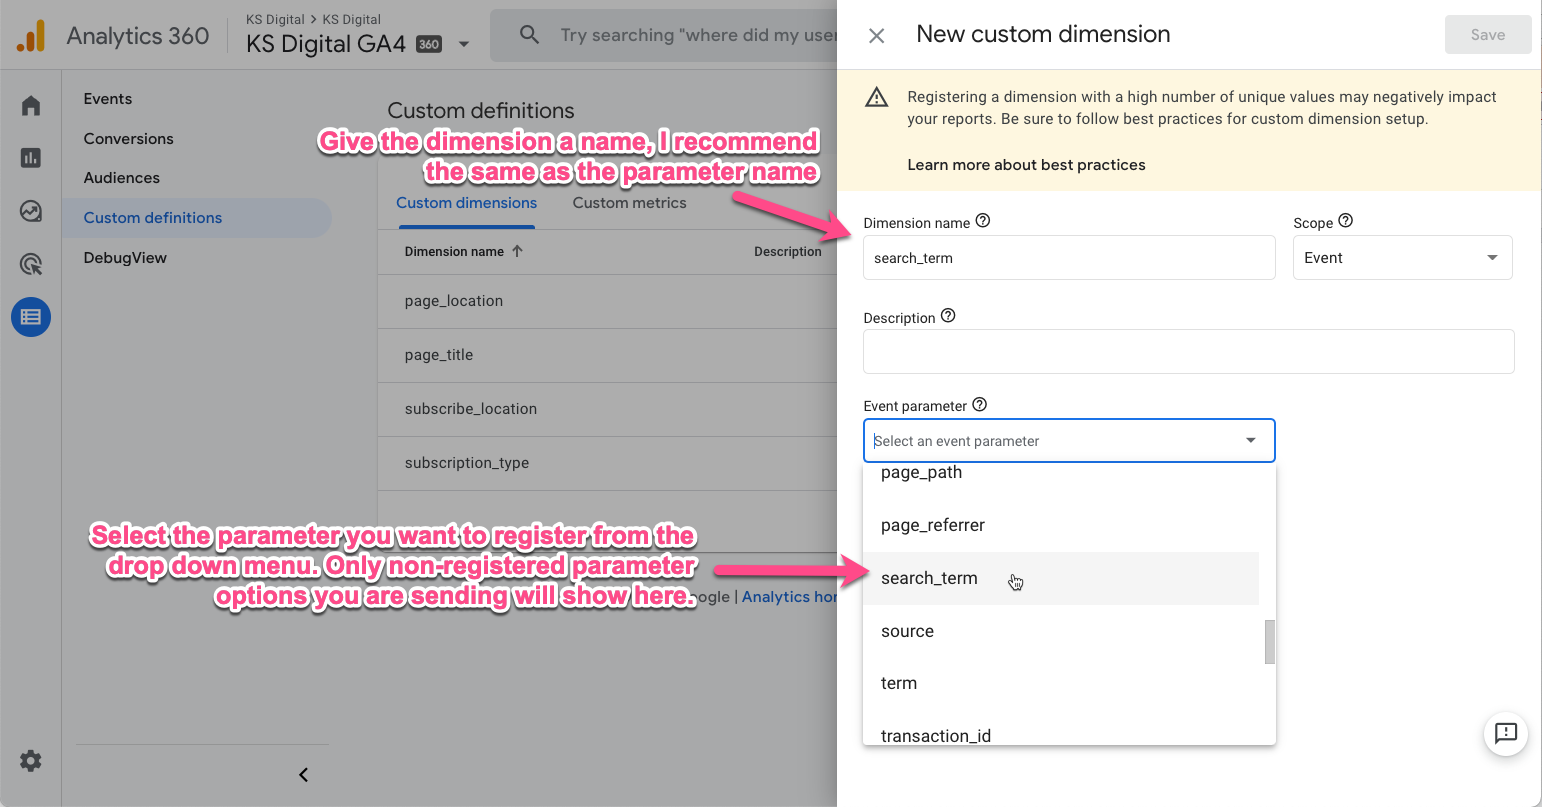
- Choose dimension name & param value
- Hit Save
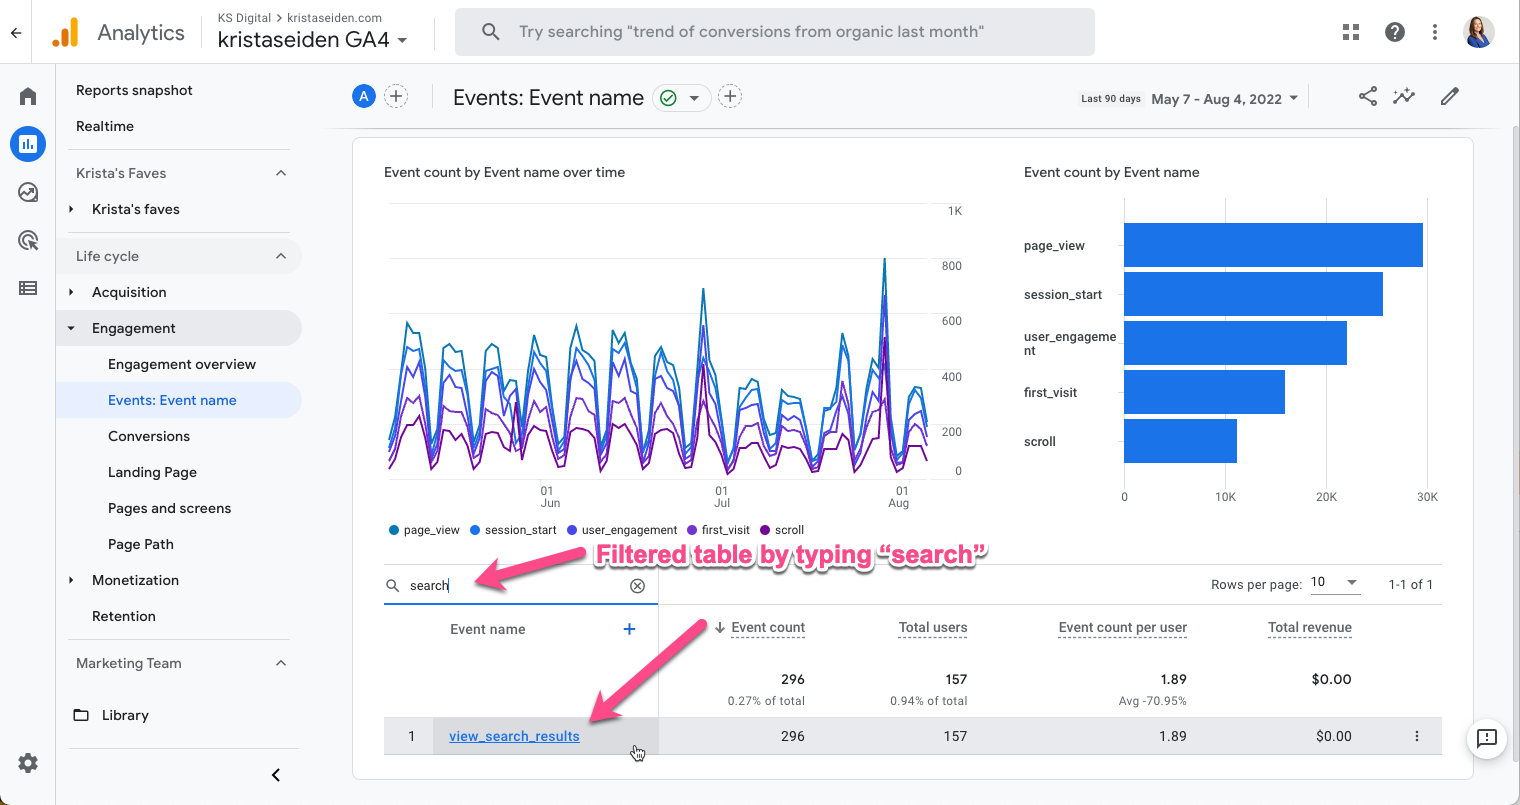
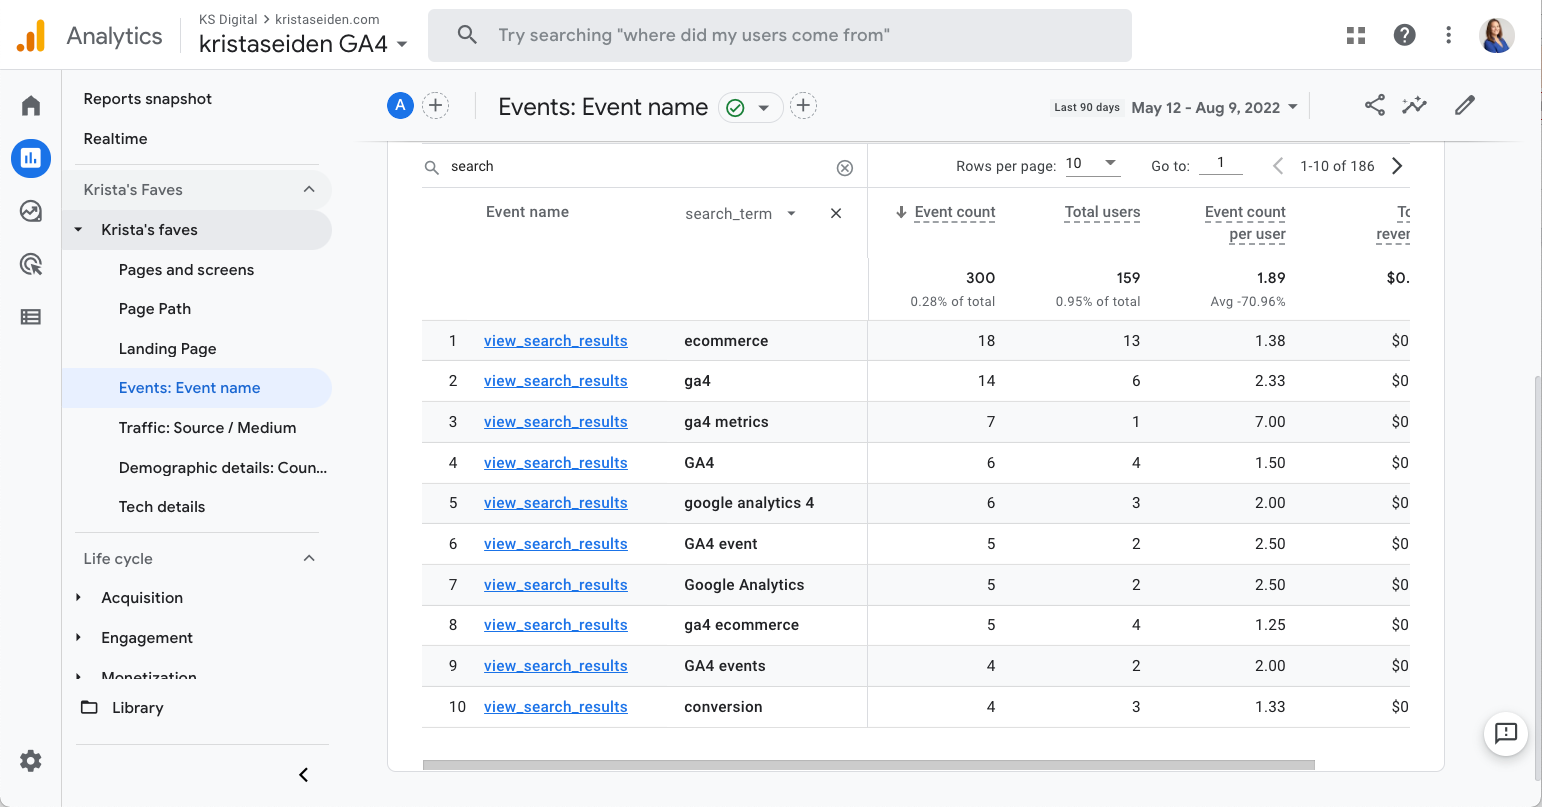
Once your “search_term” dimension has collected some data, you can now analyze your site search activity. You can find the “view_search_results” event (that’s the auto name for the site search event) in the Events table. In the screenshot, I filtered the table for it.
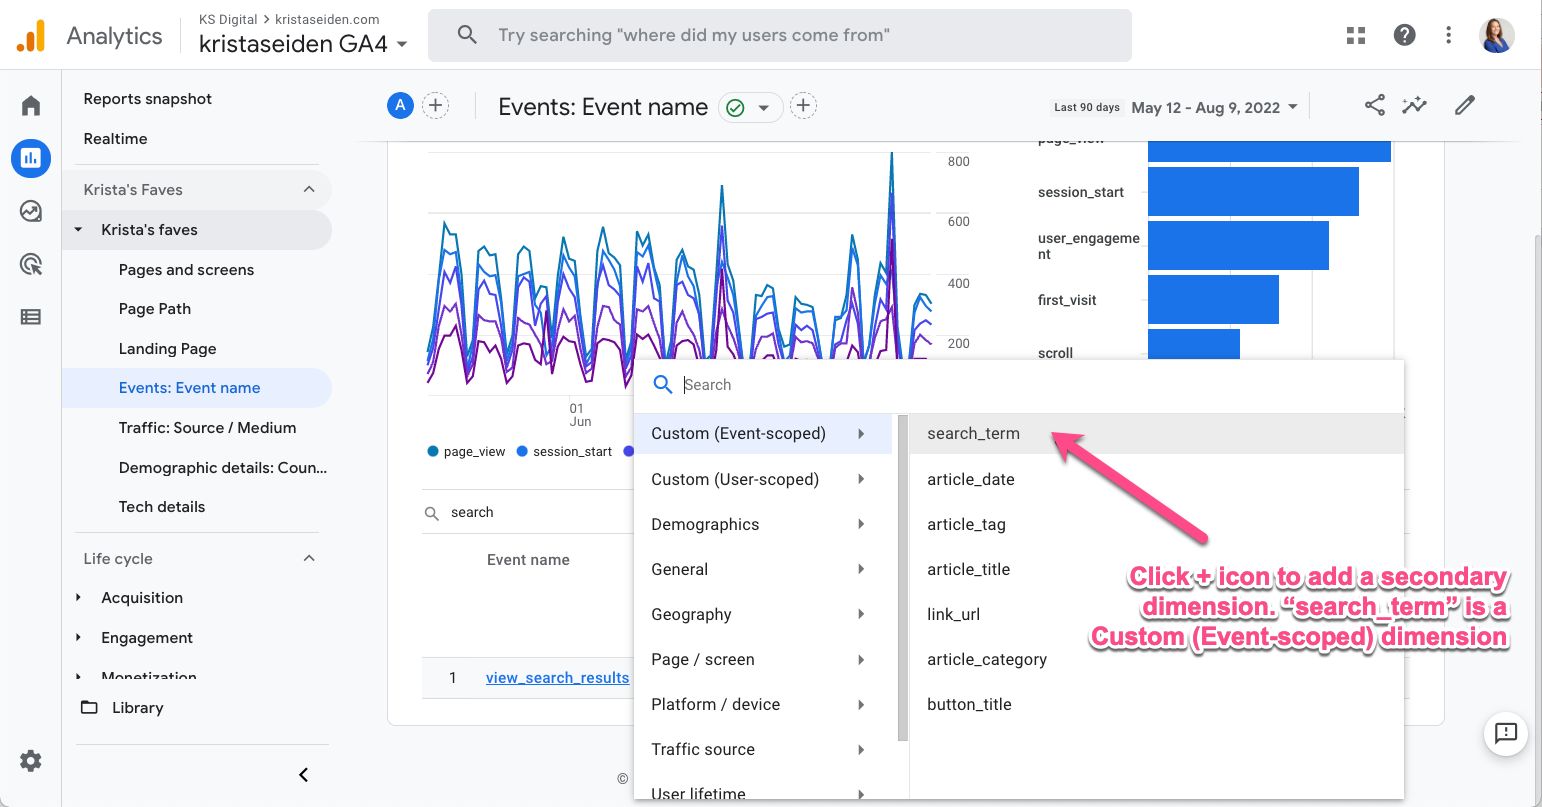
Next, there are three ways to analyze site search results with this event. The first way is to add a secondary dimension of “search_term” (the param you registered) to see a breakdown of the terms used in your on site search.
The second way is to click into the “view_search_results” event name (it’s a link). This will take you to a full report breakdown showing data like event & user count, country, demographic breakdowns, and the search_term parameter for this event.
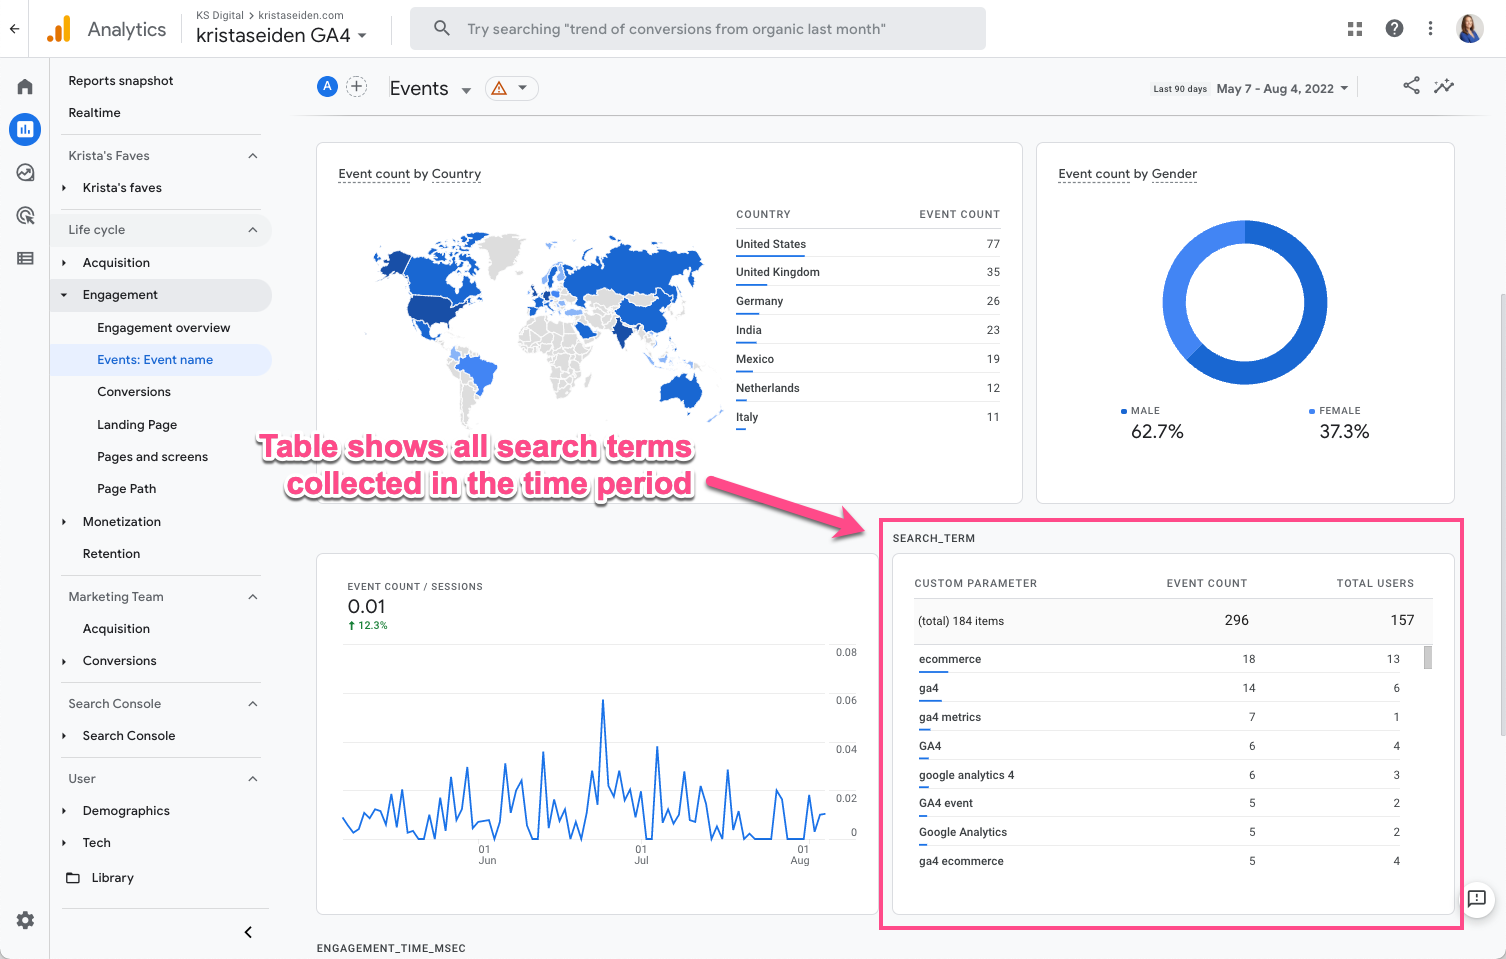
This full report view is nice because you see more info about the event (or about the users doing the event) than you get with just a table showing the term data.
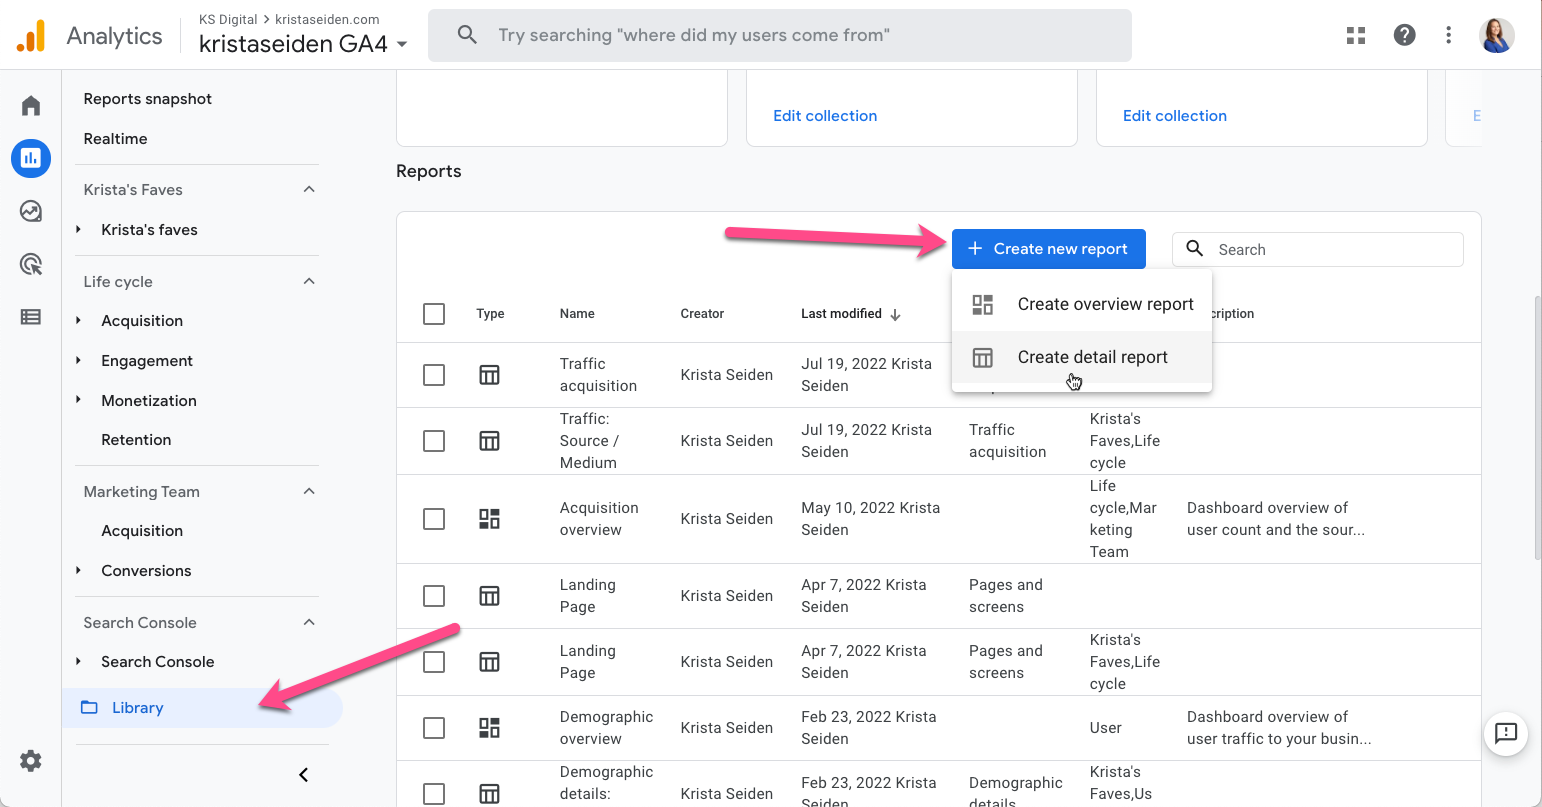
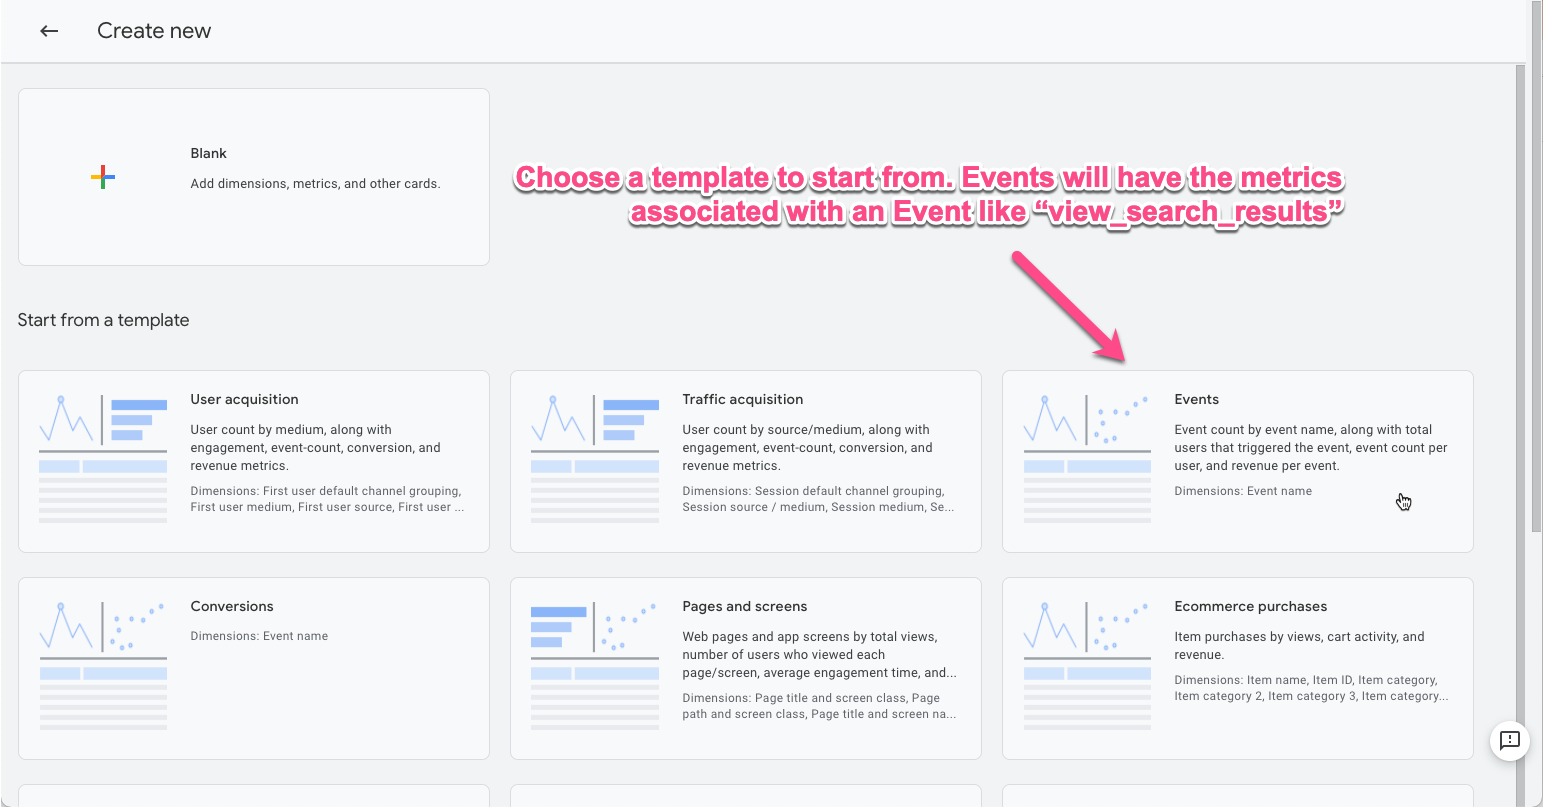
The last way to see this data is by creating a custom report. Note this is more involved and you need edit access to be able to build this view of your data. In the Reports section, click on the “Library” tab and then click on “Create new report”
Choose to create a detail report. You can start from a blank template or a specific technique. Since search_term is tied to an event, I’ll use the Events template.
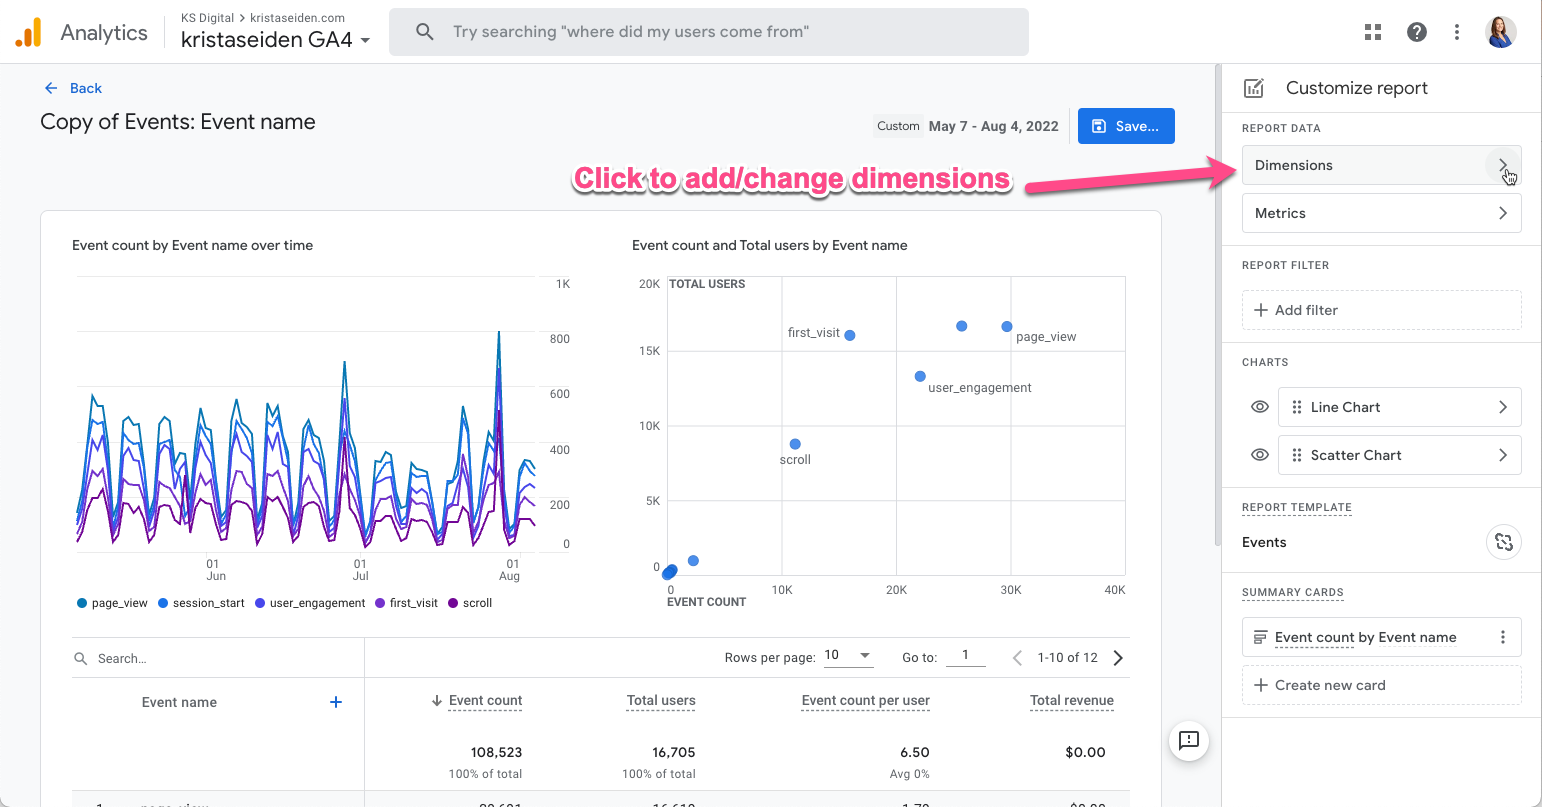
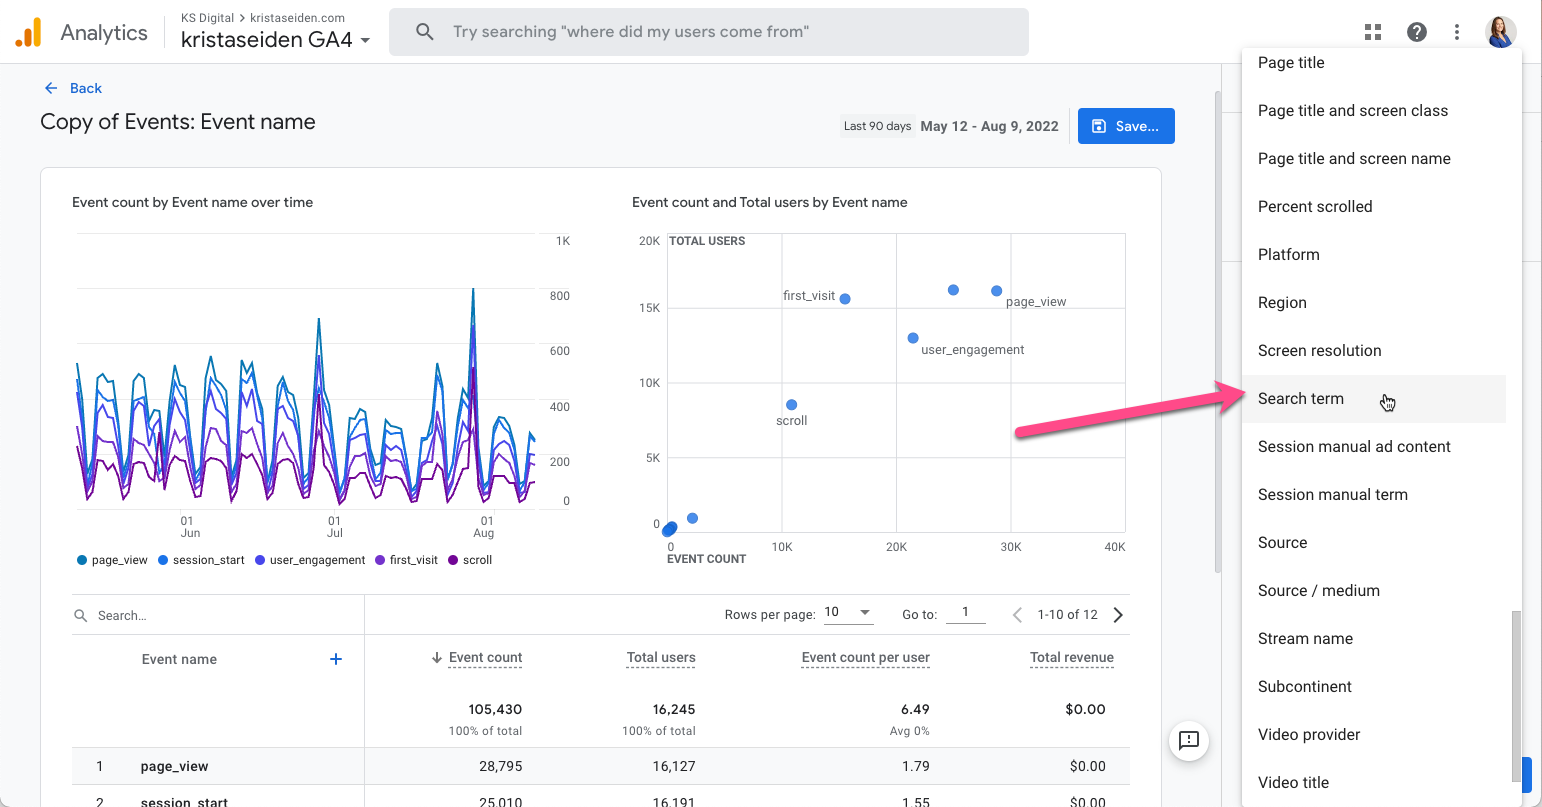
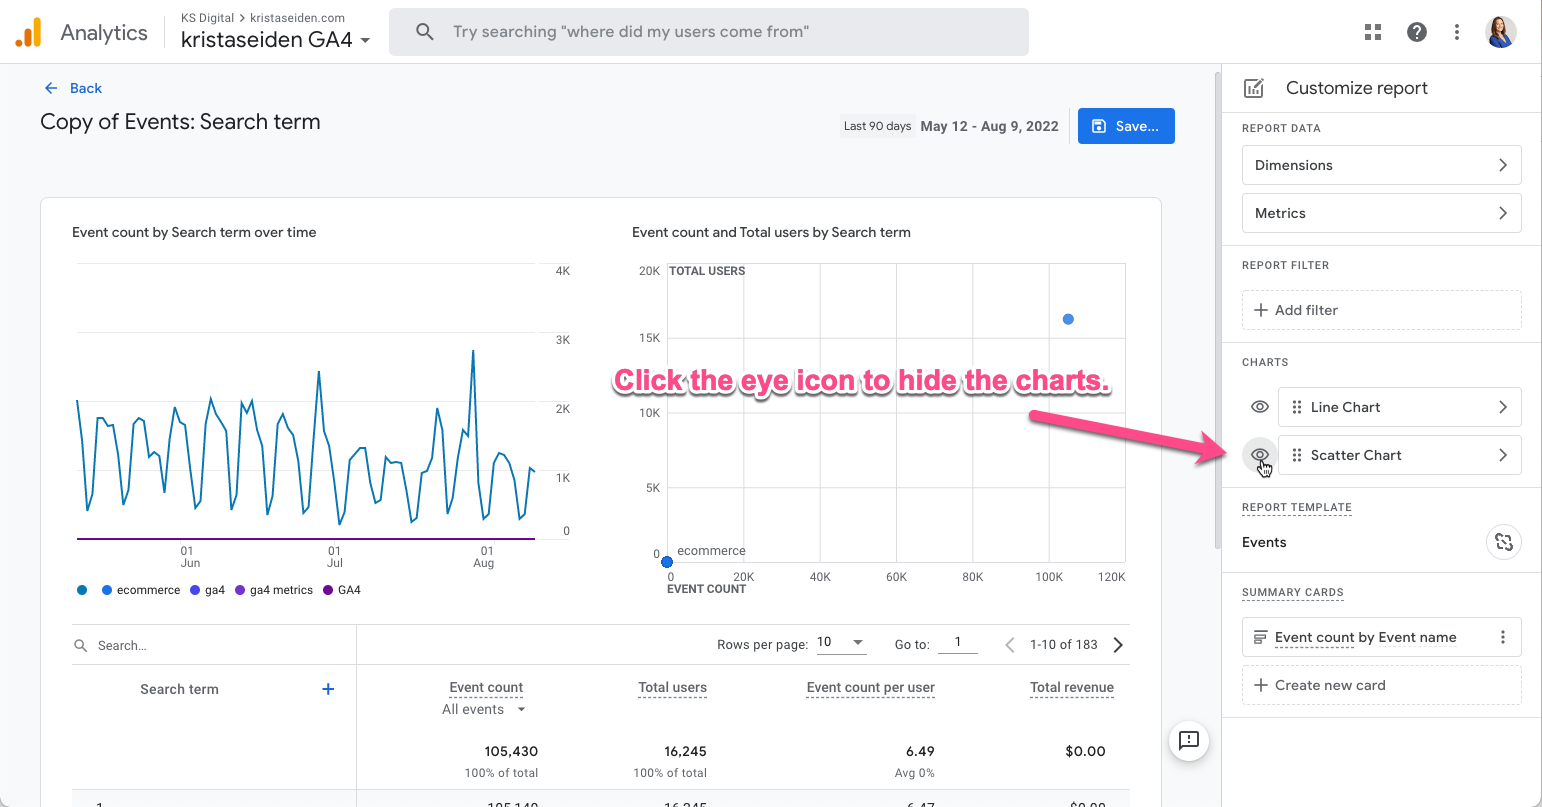
When you land in the report builder, you’ll click on “Dimensions” to add or change what dimensions are showing in the report. In this case, we’ll search to add “Search term” to the list.
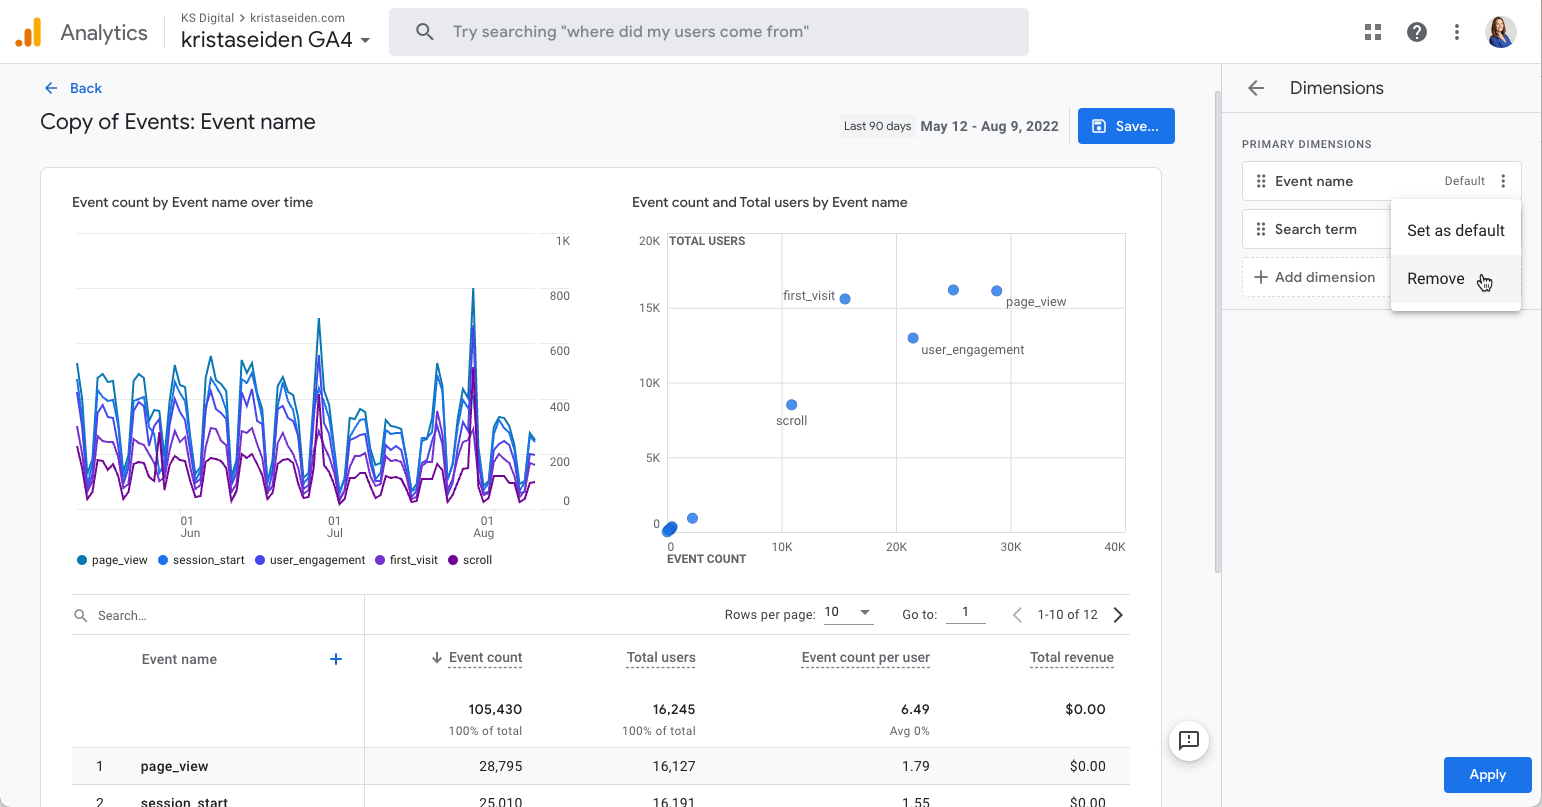
Once that is selected, there are a few clean up items for the report and the table isn’t perfect. We’ll remove the “Event name” dimension. We can’t yet filter out that blank row where events don’t have a search term, so the graphs aren’t useful. We’ll just turn them off instead.
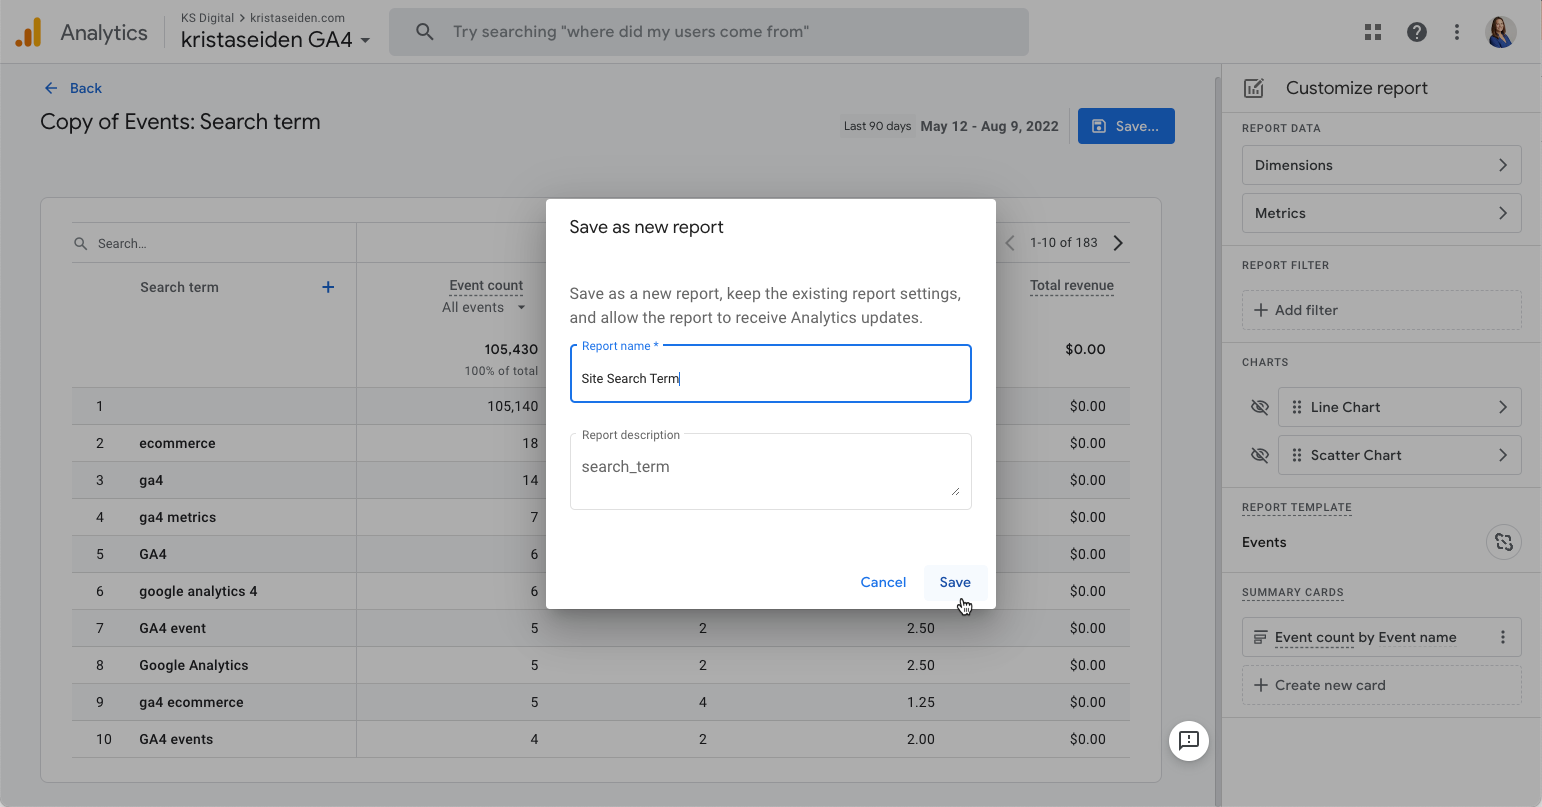
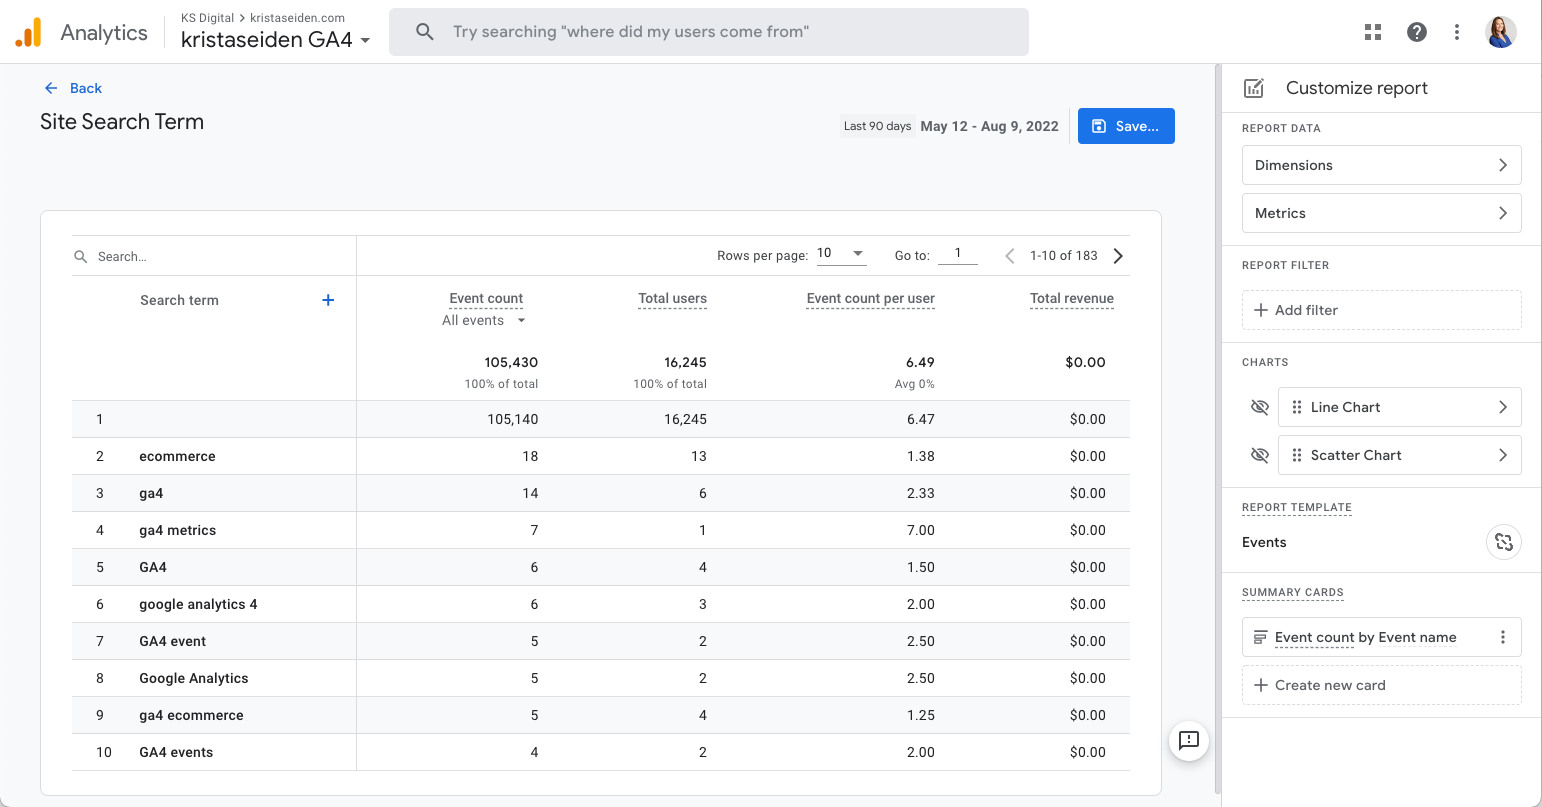
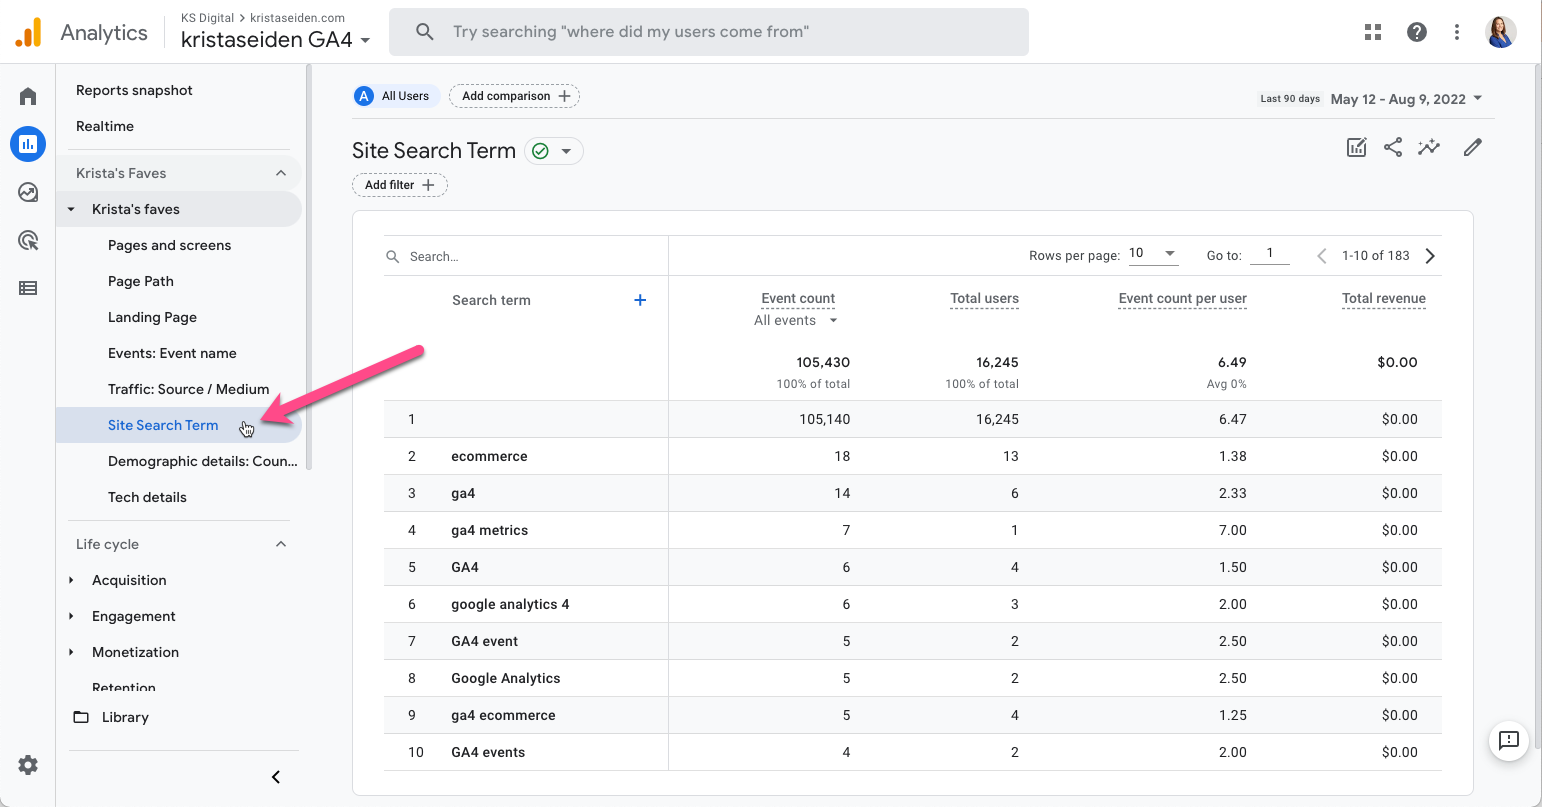
The result is a clean table report and we’ll then click “Save” to save it as a new report. Give it a meaningful name (in this case I chose “Site Search Term)
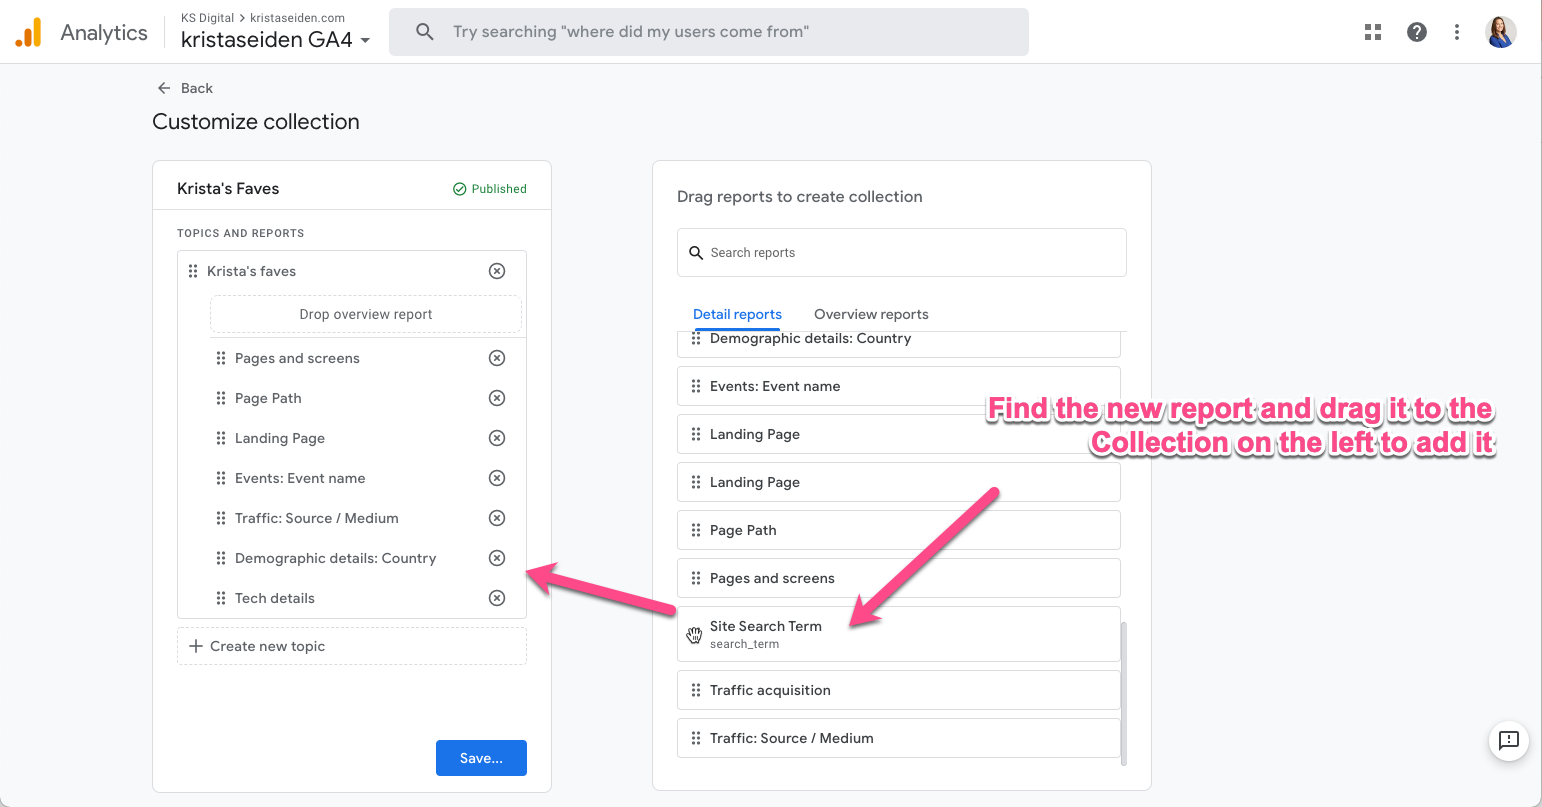
The last step is to now add your new report to the left hand navigation – to do this, you’ll add it to a report collection in the Library section.
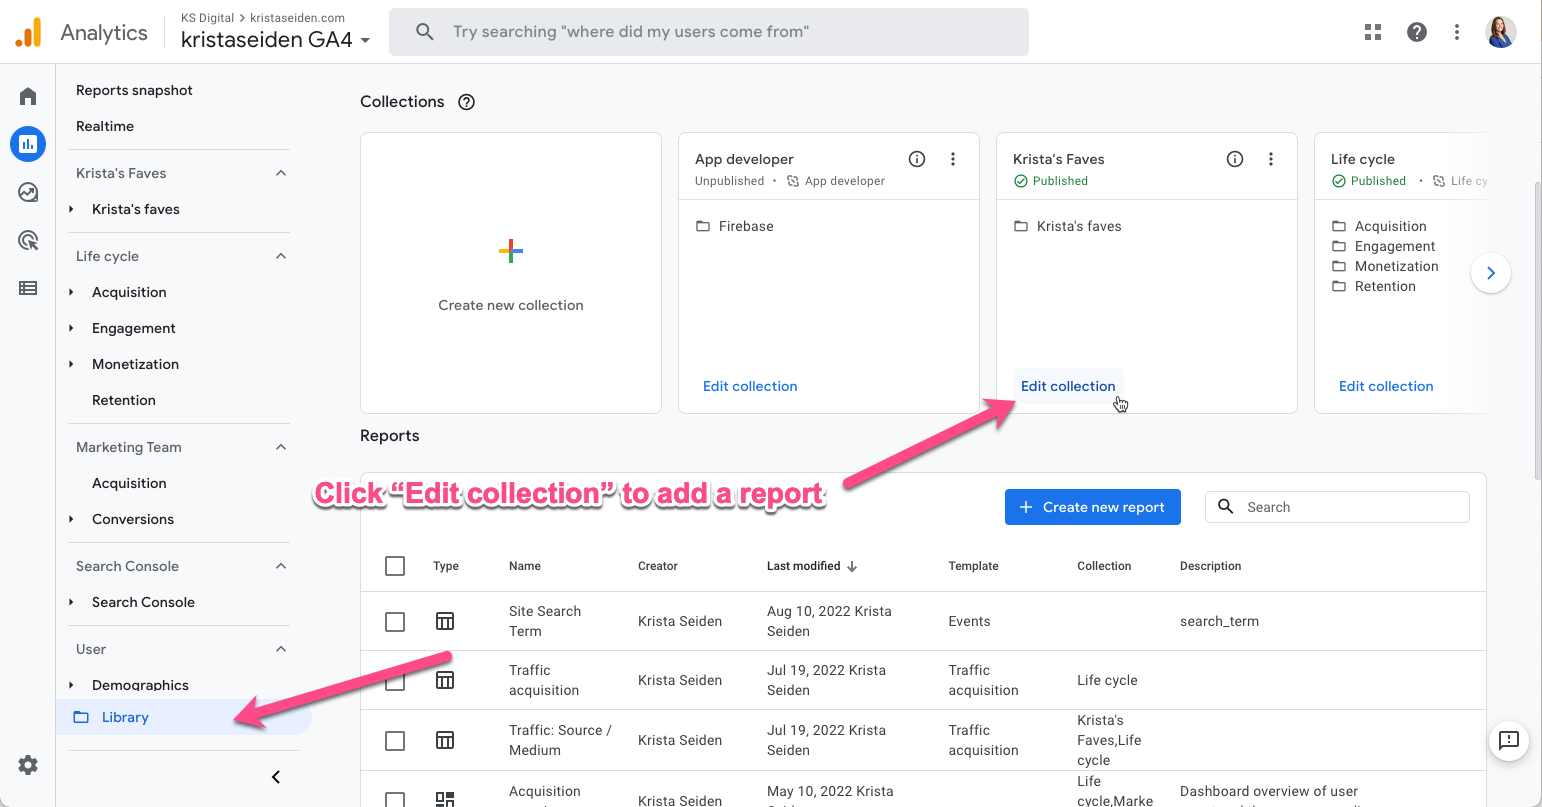
Find the report you just created in the reports list on the right and drag it to the collection on the left. Hit save changes to current collection, and then this report will show in your left hand nav.
Now you’ve got three different methods you can use to analyze your site search results data. Choose the one that works best for you. Which do you prefer?


Cedric
Hello, Thank you
Why you don’t use explore report ? You can add exactly the same information without add custom parameter and create a new report
Krista
Hi Cedric,
Yes, you can definitely build this in Explore, but my goal was to show how to do this in the Reporting UI since many people find Explore to be a bit advanced since it’s all free-form/build from scratch.
Best,
Krista