Mixing Google Analytics Dimensions and Metrics
Following Krista’s excellent post on using secondary dimensions in Google Analytics, this post will explain the GA represents your data using its internal data model and why it’s important to understand this. You’ll see that certain combinations of metrics and dimensions don’t mean what you might think, and that some are actually completely invalid. We’ll cover examples of secondary dimensions and custom reports where seemingly sensible reports are invalid and how to spot and avoid these mistakes.
Introduction
We see the world through our eyes, we smell the world through our nose, we taste it in our mouths and we feel it in our finger-tips. We perceive the world using the same senses but, philosophically we have unique, individual perspectives when we think about the world and what it means to us. We have our own models of the world in our heads.
Google Analytics has its own view of the world which it uses to present our data to us. It uses an abstract data model to build a picture of our data to make sense of it, process it and to present meaningful reports.
As advanced analysts we need to know about this model and to understand it. If you’re using custom reports or secondary dimensions as described in Krista’s post, failing to understand the model can affect your reporting and potentially present inaccurate and misleading data.
The Google Analytics Data Model
Side Bar:
Before we get into the meat of this discussion, you really want to go and read this site – https://analyticsacademy.withgoogle.com/
What a fantastic resource?! You’re welcome for the heads-up.
GA will receive many data hits a day most likely from billions of users visiting millions of sites. To make sense of this data and to correctly deliver the right data in the right report, GA needs to somehow relate these individual bits of data together.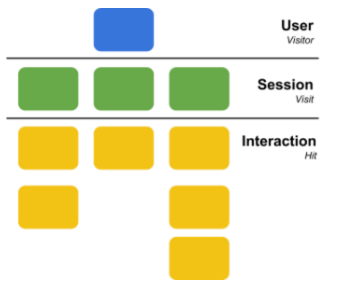
The diagram on the right (from the Analytics Academy data model page) shows the hierarchical data model used by GA.
Fundamentally, the data is generated by users using sites or apps. Right at the top of the tree is the User.
A user will use a site one or more times. Users have multiple sessions. Sessions are made up of many individual interactions or hits – screen views, pageviews, events, and social interactions, for example.
So, we see that a single user has one or more sessions and the sessions are made up of multiple interactions (hits) on a site.
These three levels in the data model hierarchy are called scopes. As we’ll see next, it’s vitally important to recognize and understand the scope of the data in our reports before doing any analysis.
Analyze with scope in mind
When you’re analyzing data, you’re seeking answers to business questions. It really helps to carefully define the business question so you can identify the scope of the data you need to extract.
1st Business Question Example:
Which channels are driving traffic to my pages?
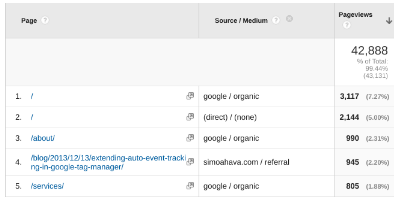
Simple enough, let’s go to the pages report and add a secondary dimension of source/medium:
Looks okay? Google Analytics returned my report and I can see that Simo Ahava is going to receive a nice birthday present to say thanks.
This report is misleading
Not so fast though! This report doesn’t say what you think. Let’s revisit the business question and think about the scope of data we need.
Which channels are driving traffic to my pages?
When we ask questions about channels driving traffic, we’re asking how users found the site – where did their visit come from? For example, they might click on a search result. Once they’ve clicked the link and arrived at the landing page, they’re free to roam about the site and view any other page they choose. This means that the report tells us that users who clicked through from simoahava.com viewed one of our blog pages 945 times.
Our first report actually told us which pages (hit scoped interactions) are being viewed during sessions that started from certain traffic sources (session scoped data). See how that mix of scopes changes the meaning of the data?
What we really need to ask is which channels are driving users to specific Landing Pages.
A single session can only have one traffic source which means the traffic source is a session scope dimension. Pages are hit level but landing pages are session scoped – a single session can only have one landing page where the session started.
This report is correct
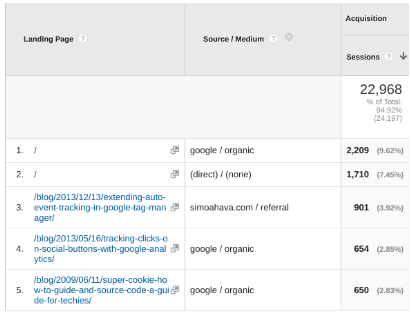
If we want to know which page a user landed on from a traffic source, we need to use the Landing Page report with Source / Medium as the secondary dimension:
It looks like Simo’s birthday present just got more expensive! Notice the landing page where 901 sessions started – this is a different number to the overall pageviews of 945 as we saw in the first report.
In the first report we mixed a hit scoped primary dimension (Page) with a session scoped secondary dimension (Source / Medium) in the same report. It answered a question but not the one we asked.
Google Analytics will let us build this report because it might be a valid question but it won’t always let you mix dimension and metric scopes. Take a look at the context tabs on the Top Events report, for example:
Notice there’s no ‘Goals’ tab? Individual goal conversions only happen once per session. This makes goals session scoped. Events are hit scoped. Metrics for goals and events cannot be mixed in Google Analytics.
2nd Business Question Example:
How many users who added products to their cart completed their purchase?
Assume that we’re tracking “add to cart” actions using events and we have a goal that tracks purchases. As we just saw, events are hit scoped and goals are session scoped. How do we show this data if GA won’t let us mix event dimensions with goal metrics?
Mixing scopes using segments
We solve this oil-and-water mixture using segments but we need to choose our segment conditions carefully.
The wrong segment
What if we build a segment that includes sessions where an event with a category of “Add to cart” happened? Applying that segment will show how many sessions contained “Add to cart” events but remember, users can have multiple sessions. This segment doesn’t answer our question, it’ll show the count of sessions that contained the event, not the count of users:

A better segment
We need to make sure our segments are aware of scopes too:
This segment seems to answer the question – we’re only interested in users who added products to their cart so we’re home and dry, right?
The right segment
Again, not so fast! Remember, users can have multiple sessions and they might add to cart in multiple sessions but might not transact. We want to know how many users added to cart and transacted:
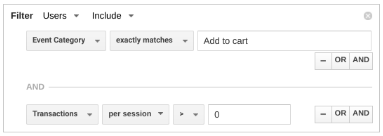
This segment will do the job. We needed to add a second statement to make sure we see users who had a session where they had an Add to cart event and that transactions per session must be greater than zero.
Dimensions and Metrics – A tool to help choose the right scope
Try this: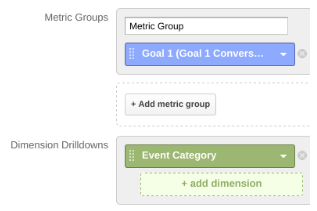
1. Create a new custom report
2. Add a metric of goal 1 conversion rate
3. Add a dimension of event category
4. Save it
5. See any data?
GA will let you combine dimensions and metrics with different scopes. If we can build a report with multiple dimensions and metrics, it doesn’t mean it’s the right one. We need avoid the scope trap by thinking about what data we’re including in the report. This seems complicated, but there is help at hand.
Google provide a tool that lets you test which dimension and metric combinations work – the Dimensions & Metrics Explorer:
https://developers.google.com/analytics/devguides/reporting/core/dimsmets
Exploring Dims and Mets
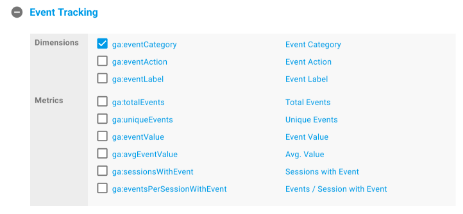
Try this first example to see how the tool works. Find the Event Tracking section, open it and click the checkbox next to Event Category:
Now scroll up and find the Goal Conversions section. Open it and you’ll see many of the goal metrics are not available:
This confirms that event dimensions and goal conversion metrics don’t mix. We won’t fall into that trap!
Using dimensions and metrics wisely
This introduction to the Google Analytics data model has highlighted some easy traps you can fall into as you level-up your analytical skills. You always need to fully parse the business question you’re answering with data and you also need to carefully choose the scope of the dimensions and metrics.
There is a tool to help you but your awareness and use of data model is a key addition to your analytical arsenal of skills.
*This guest post was written by Doug Hall, Director of Analytics at Conversion Works. Doug has extensive experience in web analytics and conversion rate optimisation and is one of the UK pioneers of multivariate testing for ecommerce websites. Follow him on Twitter @fastbloke or on Google+ +Doug Hall.



Pingback: Analytics Reading List | May 2016
Olga
Hi Krista! Thank you for this post by Doug Hall. I meet a lot of analysts that don’t yet understand the internal data model of GA. It is hard to explain what dimensions and metrics should and shouldn’t go together. I made an attempt in this blog post: http://www.analyticscanvas.com/session-vs-page-level-dimensions-google-analytics/. Now I will recommend them to read your blog post too. Thanks!