Over the past couple of weeks I have presented at a few conferences (SummitUp in Dayton, Ohio and UnSummit in Salt Lake City, Utah) on the topic of People, Process, and Platform.
Now, before you roll your eyes because you’ve heard it all before, let me let you know that you won’t be getting my whole speech in this blog post. In fact, you won’t be getting any of the core parts. Instead, I want to remind you of the importance of the people you have looking at, analyzing, interpreting, and telling stories about your data, as I did to the audiences at these conferences.
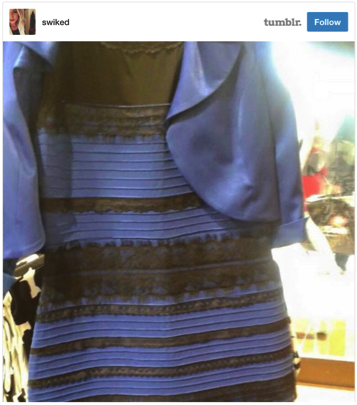
Most of you will have seen #TheDress, #DressGate, #WhiteAndGold, or #BlueAndBlack over the past couple of weeks. For those of you who haven’t, let me quickly catch you up… There was a dress, posted on instagram, which basically broke the internet and derailed productivity for a good portion of the internet browsing world because it set off a fierce debate about what color it really was. Was it Blue and Black or White and Gold.
It sounds crazy that there would even be a question between those two color schemes, they are so different! But, remarkably, depending on the context of the light you looked at the dress in, the color you interpreted the dress to be could change. Some people say they only ever see it one way.
Some say they see it both depending on the light. I personally was totally in the White and Gold camp for a solid week, and then of course, as I was on an airplane building a presentation for SummitUp using the dress as an opening story, all I could see was Blue and Black.
So what color do you see?
Buzzfeed wanted to settle the debate, so they took a poll:
And those who couldn’t see what others did went crazy:
This probably happened for a few reasons:
Social Media buzz: #TheDress was the top trending hashtag worldwide (#whiteandgold & #blueandblack also trended)
Intrigue – every time I look at it I change my mind!
FOMO – everyone else is talking about it
There were even some pretty timely brand marketers who took advantage of the opportunity to send some witty tweets to capitalize on #dressgate: Pizza Hut tweeted a picture of a cheese pizza and said ‘it’s white & gold’
The scientific explanation, from the New York Times Science section, says this:
“Our perception of color depends on interpreting the amount of light in a room or scene. When cues about the ambient light are missing, people may perceive the same color in different ways.”
Putting this more simply – the color of dress we see depends on the light around us when we see the picture because our eyes react and adjust depending on the type of light that surrounds us.
So why am I bringing up #DressGate on my Analytics blog?
Because Digital Analytics is ALL ABOUT CONTEXT.
The people who are looking at, analyzing, interpreting, and telling stories about your data. So remember the importance of hiring good, smart, talented, passionate, driven people. Your data depends on it.
Digital Analytics is all About Context – Lessons from #TheDress
Over the past couple of weeks I have presented at a few conferences (SummitUp in Dayton, Ohio and UnSummit in Salt Lake City, Utah) on the topic of People, Process, and Platform.
Now, before you roll your eyes because you’ve heard it all before, let me let you know that you won’t be getting my whole speech in this blog post. In fact, you won’t be getting any of the core parts. Instead, I want to remind you of the importance of the people you have looking at, analyzing, interpreting, and telling stories about your data, as I did to the audiences at these conferences.
Most of you will have seen #TheDress, #DressGate, #WhiteAndGold, or #BlueAndBlack over the past couple of weeks. For those of you who haven’t, let me quickly catch you up… There was a dress, posted on instagram, which basically broke the internet and derailed productivity for a good portion of the internet browsing world because it set off a fierce debate about what color it really was. Was it Blue and Black or White and Gold.
It sounds crazy that there would even be a question between those two color schemes, they are so different! But, remarkably, depending on the context of the light you looked at the dress in, the color you interpreted the dress to be could change. Some people say they only ever see it one way.
Some say they see it both depending on the light. I personally was totally in the White and Gold camp for a solid week, and then of course, as I was on an airplane building a presentation for SummitUp using the dress as an opening story, all I could see was Blue and Black.
So what color do you see?
Buzzfeed wanted to settle the debate, so they took a poll:
And those who couldn’t see what others did went crazy:
This probably happened for a few reasons:
There were even some pretty timely brand marketers who took advantage of the opportunity to send some witty tweets to capitalize on #dressgate: Pizza Hut tweeted a picture of a cheese pizza and said ‘it’s white & gold’
The scientific explanation, from the New York Times Science section, says this:
“Our perception of color depends on interpreting the amount of light in a room or scene. When cues about the ambient light are missing, people may perceive the same color in different ways.”
Putting this more simply – the color of dress we see depends on the light around us when we see the picture because our eyes react and adjust depending on the type of light that surrounds us.
So why am I bringing up #DressGate on my Analytics blog?
Because Digital Analytics is ALL ABOUT CONTEXT.
The people who are looking at, analyzing, interpreting, and telling stories about your data. So remember the importance of hiring good, smart, talented, passionate, driven people. Your data depends on it.
Krista
You might also like
Streamview in Google Analytics
Pathing in Google Analytics
Goodbye, Google
Podcast Guest: Jumpstart with Jeffalytics
Next ArticleBest Practice Solutions Guide: Implementing Google Analytics via Google Tag Manager