An Overview of Google Analytics for Firebase
In this post, I’m going to walk you through an overview of the Google Analytics for Firebase platform, including an overview of the out of the box reports you get with the Firebase SDK.
What: Google Analytics for Firebase is the latest mobile analytics tracking platform from Google. This is meant as the next generation of mobile app tracking, taking the place of the Google Analytics Services SDK (this SDK is still supported in maintenance mode but is not being built on).
Why: The Google Analytics Services SDK was built off of the web analytics model of Google Analytics. Google Analytics for Firebase (GA4F) was built from the ground up as an app-centric analytics platform, enabling it to track app type actions in a much more intuitive way
When: Firebase Analytics (now Google Analytics for Firebase) was launch in May 2016, rebranded in May 2017
How: GA4F works via the Firebase SDK. The Firebase SDK can be used to build and develop apps and includes a number of additional features outside of Analytics, but for this post, we’ll just focus on the Analytics piece
What’s included:
- Dashboard with out of the box reporting widgets focusing on mobile/app centric metrics of interest
- Up to 500 custom events (you might think this is low, but read on to see why it’s much more scaleable than you may think)
- Up to 25 custom parameters per event
- The ability to mark an event as a conversion event, enabling attribution reporting on the event
- 25 User Properties
- 50 Audiences
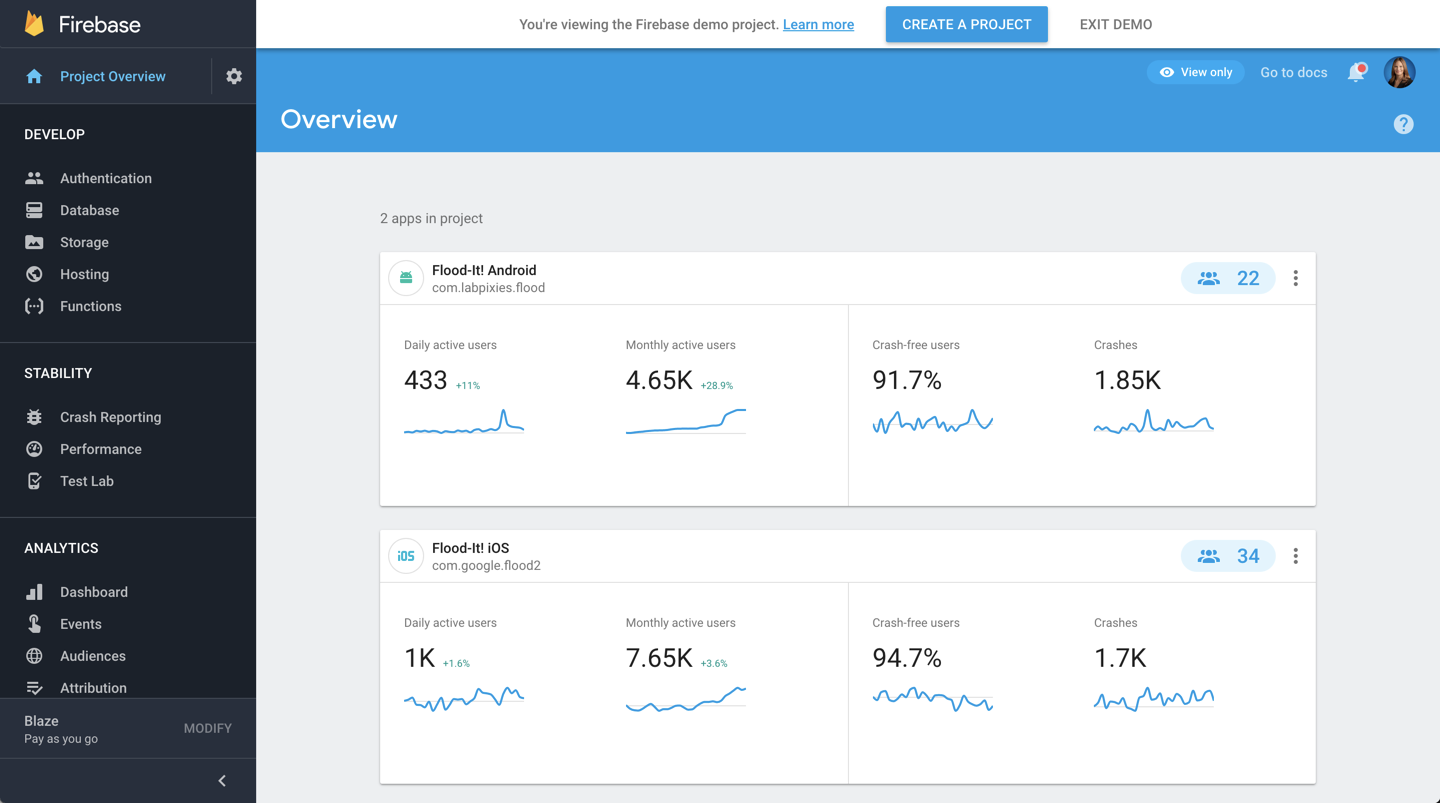
For this blog post, I’m going to use the Firebase Demo Project app, called Flood It! (you can get access to this demo project for free to follow along by following the link).
When you first login and select the project you are interested in, you’ll see this overview:
When you click into an app, you’ll land on your dashboard view for this app. This dashboard contains a lot of valuable information out of the box. Let’s walk through it widget by widget:
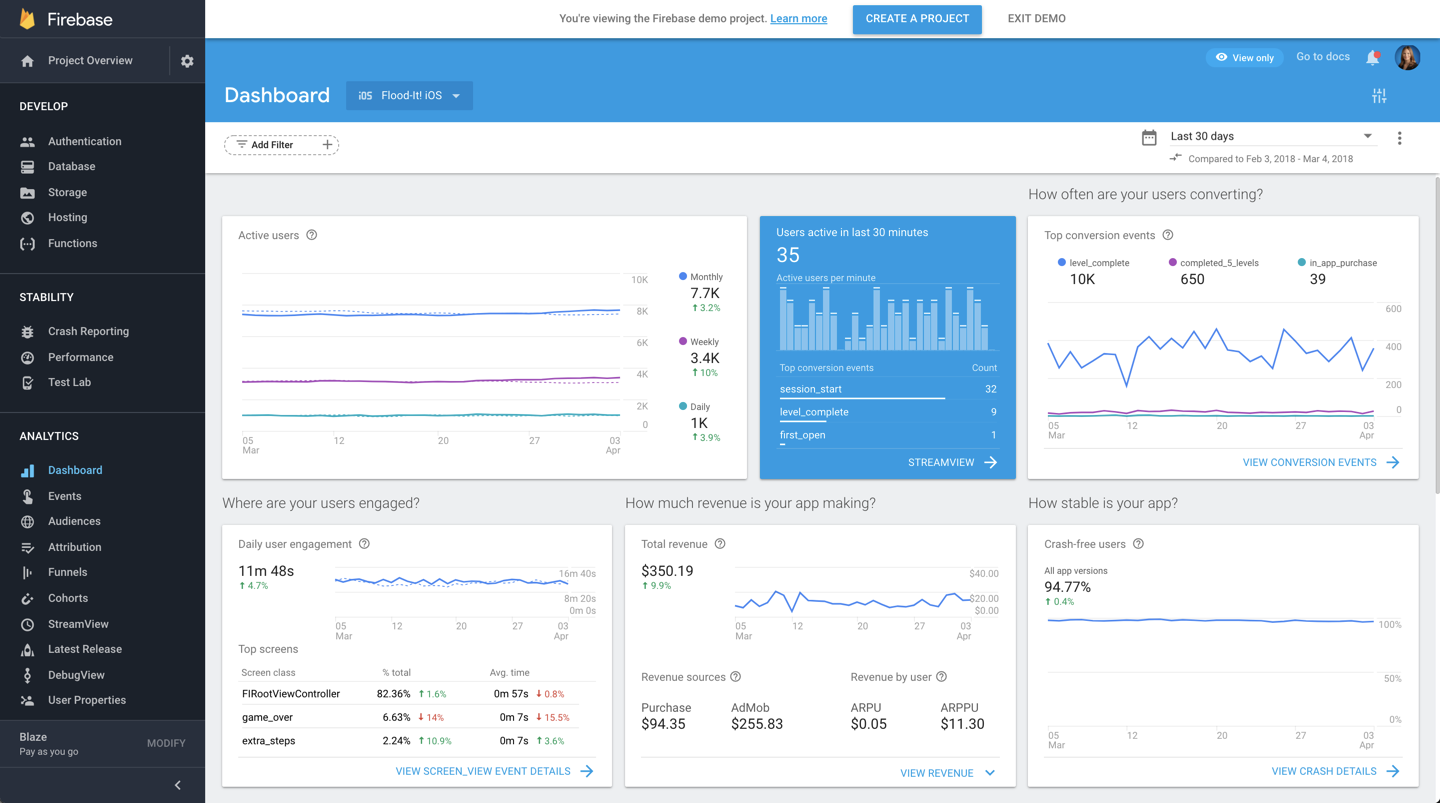
Active Users: a graph looking at Active Users Broken out by Daily, Weekly and Monthly active and we’re Comparing this day/week/month’s active to the previous period which can give a clear indication of growth or decline over time.
Active Users in past 30 minutes: This is the Streamview report at a glance, showing you real-time activity in the past 30 minutes. In the full report, you can filter down the traffic by event, parameter, or user property making this a great report for seeing both big picture of how many users are currently engaging with you and narrowing in on specific users or campaigns.
Top Conversion Events: shows a scorecard and line chart of your top conversion events, for example, in-app purchase.
Daily User Engagement: is a metric that summarizes time in foreground, or how much time end users are actually spending engaging with your app. For an apps first business, this is a really really important metric to pay attention to so you can understand the impact of your development and marketing efforts in terms of how much time you are getting in front of your users.
And one thing I really like about this metric, is that it’s actually much more meaningful than your traditional time on page metric on the web. Time on page and time on site are calculated in a manner that leaves lots of room for error, either by losing time spent on a page because the next interaction was off a tracked domain, or by overestimating time spent while people walk away for a coffee break or browse other sites that may also be in the foreground.
Due to the nature of how we use mobile devices, this metric is going to be much closer to the truth about how much interaction time you are really having with your users.
Total Revenue: This pulls in a few revenue metrics. If you have Admob linked for in app display advertising, you’ll see a high level metric of that info here. There is also direct revenue from in-app purchases shown as purchases. We sum this all up and average it out per user with the metrics Average Revenue per User (ARPU) and Average Revenue per Paid User (ARPPU), which are common metrics in the mobile space.
Crash-free Users: This gives an indication of how stable or unstable your app is by showing the percentage total of users who did not experience a crash during the time period. The higher this percentage, the better.
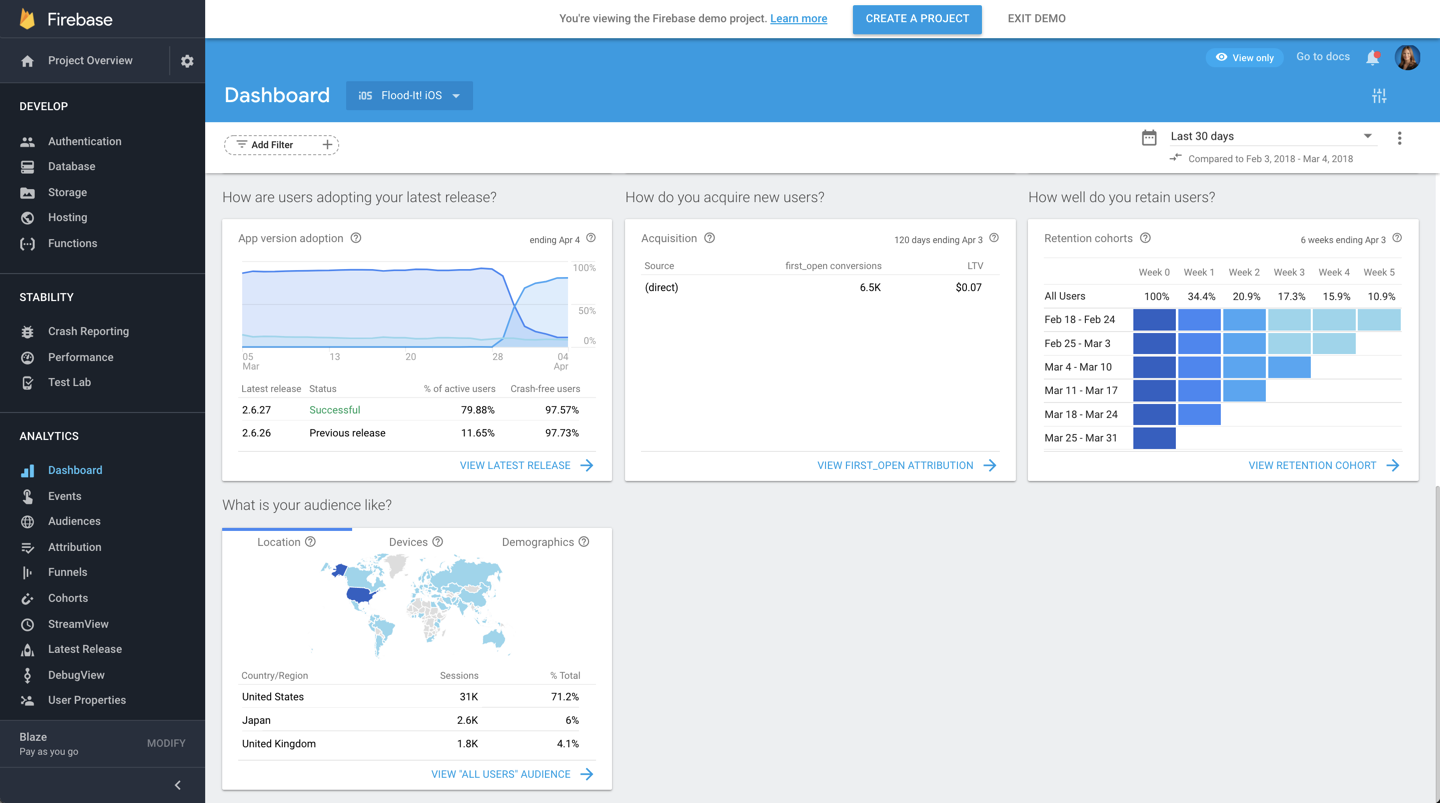
App Version Adoption: This shows how many of your active users are on which version of your app. I remember trying to make a similar report via the old GA Services SDK prior to my time at Google, and it was a lot of work to implement the app version as an event and then pull that data to get what was essentially the same thing as this report here, which is available in many of the mobile app platforms today. This is especially important to watch as you release a new version of your app, and you can see the uptick and the stragglers who have yet to update. You can then use that information to target those needing to update with notifications or even a special offer to go ahead and update the app. This is super powerful!
Acquisition: This is a Cross-network Attribution summary (this particular account doesn’t have any 3P networks driving traffic since it has no paid promotion), which gives us an overview of the mobile version of a source/medium report alongside the first open and LTV metrics each source has contributed to. Similar to web, you’ll get users who download and open your app coming from several different sources, and you want to be able to track those installs, and especially those that lead to In App Revenue, back to the campaigns they came from so that you can shift your marketing budgets towards your highest converting campaigns.
Retention Cohorts: this summary can be useful to understand how different groups of users continue to engage over time. For example, perhaps you’ve run different campaigns in different weeks, to these different cohorts of users. You’ll be able to see if this has an impact on their longer term retention.
Audience (Location, Devices, Demographics): This info is similar to what we have in Google Analytics, using Google’s audience data to enrich your data sets. One unique thing about GA4F is that this Audience info is available in all event detail reports, specific to that event so you can easily see a demographic breakdown by event.
As you can now see, there is a lot of valuable information available for you out of the box with the Firebase SDK and via the Google Analytics for Firebase dashboard.

Pingback: Digital Debrief – What’s New in Google Analytics for Firebase
Nishaanth Ram
Can you share me what are the important metrics we need to check in firebase for daily tracking.